|
The final week of summer research is here, and the experience feels simultaneously as though it passed by in a flash and at a crawl. At the time of writing, the research symposium already passed and the interns of OIMB have demonstrated their research with passion and clarity, proudly sharing the product of two months’ effort while successfully defending their methods and data interpretation from the steady flow of questions posed by fellow researchers and science enthusiasts. The experience was enjoyable, and far more relaxed than many of us had expected as we prepared for criticism in the days leading up to the symposium. I would describe the questions posed to us as being much closer to friendly interest than real criticism, but the idea of seasoned researchers picking apart our hard work was powerful motivation to ensure we were caught up on our organisms and able to clearly explain the elements of our research. The posters themselves were designed elegantly and I felt that they fully expressed the effort poured into them during the preceding weeks. My own poster was aimed at expressing the vertical distribution of pyrosomes by several measures while explaining the purpose and methods of the research. Demonstrating the relationship between pyrosome abundance and environmental parameters was accomplished by reviewing the 33 summer videos for the depth in each video that contained the highest number of pyrosomes. These depths and associated environmental data were then used as data points to show if there are any parameters which pyrosomes favor above others. The closest association revealed by the data showed that the depths containing the highest amount of pyrosomes tended to fall within 8 to 11°C, with some outliers placed closer to 17°C from a cast outside of Newport that had unusually high seawater temperature. There also appeared to be a fairly strong relationship with fluorescence, a measure of phytoplankton content, in which most of the depths containing the highest amount of pyrosomes appeared close to 0. This seems to indicate that the pyrosomes were mostly placed below the surface mixing layer where fluorescence drops off rapidly. Pyrosomes have already been observed to accumulate near the bottom of the surface mixing layer and this observation was reinforced my own data. It is also apparent when looking at a representation of every pyrosome’s location by depth that their vertical positions varied quite a bit during the day, while accumulating near surface water at night. Unfortunately, I was not able to incorporate the winter, 2018 cruise data into my research because I did not have time to process the videos from both cruises, but I am beginning to process those videos now in an effort to continue research past completion of my research poster. I had previously been under the impression that fewer pyrosomes were observerd during the winter cruise due to a confusion with the data that I had in my possession, but the case seems to be quite the opposite as well over a hundred pyrosomes regularly appear over short depth intervals rather than the ten or so that I typically observed in the summer footage. I am interested to process the remaining winter footage in the future see how it compares with the summer footage. Several weeks ago, I posted an entry into this blog regarding my feelings on the REU program as a whole, and those feelings have only been reinforced since that point in the program. I spoke about how the program allows a participant the chance to think creatively and practically about their area of interest, and about the rewarding experience of seeing one’s own effort come to fruition, something that I get to experience fully at the end of the program. I believe that this sort of experience is a major benefit to anybody wavering in their education or career plans, as well to those who are simply feeling worn down by their long journey through the sciences in college. Of course, a research experience looks fantastic on a resume and I think that coming into this program looking forward to that reward is fine, but I strongly believe that this should come as a secondary concern to the experience itself. I think that the same is true of coming into the program by treating it like a summer camp. To anybody reading this blog with the intent to participate in the OIMB REU program, trust that you will have enough time to make friends and some fun memories while you are here, but I urge you to think first about what it is you actually want to work on! What actually interests you? If you could work on anything for 2 months, what would it be? This is one of the rare opportunities for your interests to take center stage and the more interested you are, the more your efforts will shine. 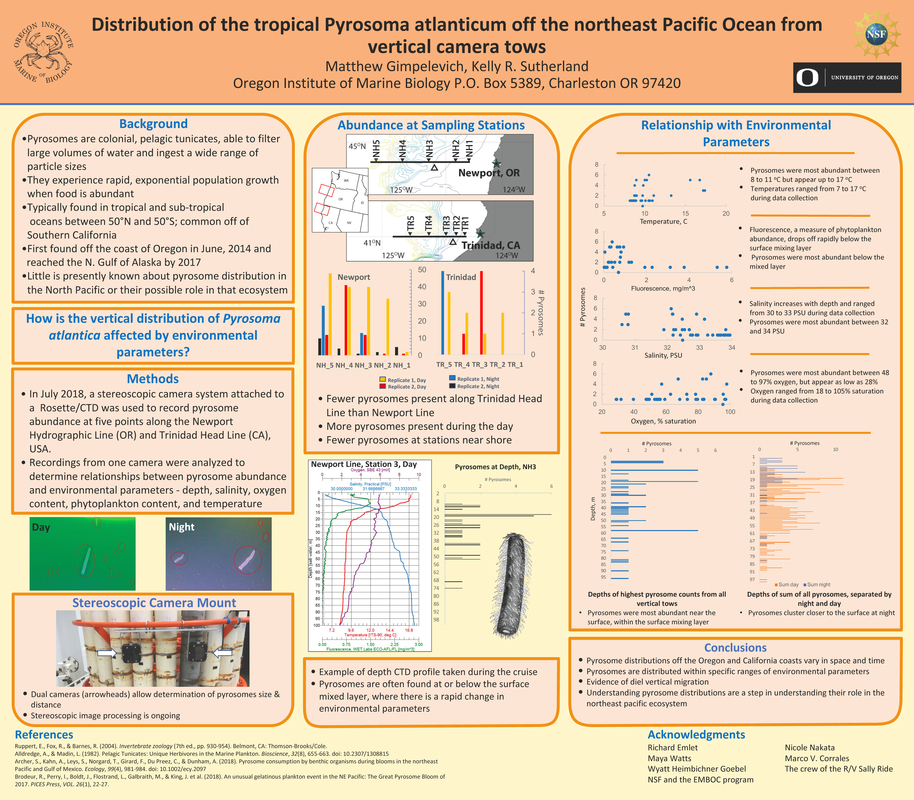
0 Comments
The OIMB Summer REU program is coming close to the end and so the final effort for finalizing data and constructing a poster has taken up the last several days. I had expected the actual creation of a poster to feel like a puny task in comparison to several weeks of dedicated video analysis, and my expectations have been proven wrong. All of the ingredients for a quality poster to represent my summer research are on hand, but it turns out that organizing those ingredients into a concise and coherent display that allows a passerby to understand months of effort at a glance is no easy thing. I am actually still in the process of finalizing my display and I am finding it particularly difficult to fit all of the graphs necessary to express my results in an elegant way. It is easy to lose time on the process of poster beautification, but the organization of a science poster really is important to expressing the elements of research coherently to an audience. The best presentations I have seen in poster rough drafts so far tend to organize their data into columns of descriptive elements, data presentation, and conclusions, while separating major sections with their own containing boxes. My poster creation is made somewhat more urgent because it happens to coincide with my final data analysis and I am finding myself bouncing back and forth between my poster and my data, trying to develop a logical way to present my data while ensuring that it fits nicely into the presentation. This has been a confusing process, but I have found it somewhat helpful in thinking of ways to display my data as any graph that I put together must be immediately judged for its effectiveness in the final product.
Another productive week of video analysis has passed, and I am getting closer to finishing with this stage of my research. I found dramatically more pyrosomes in the water outside Newport, OR than outside of Trinidad, CA, but I currently have no ideas as to why that is the case. I have also noticed that the pyrosomes recorded very rarely mixed in with water layers containing significant numbers of visible zooplankton such as krill and jellies, which tend to exist together. Typically, these species can be found in deeper water during the day, at around 50 meters or more, but during the night may be found close to the surface. I have noticed that very few pyrosomes can be found at all in cases where zooplankton and jellies are near surface water, but these cases usually occur when filming relatively close to shore in shallow water, from about 60 to 150 meters deep. In relating this to observations that I made in the previous week, I believe that the presence of these dense zooplankton populations are a more likely factorof pyrosome absence or abundance than predation by fish, but I cannot rule out the idea that sea state has a role to play as well. It is also possible that there are other factors at work determining the depth and abundance of pyrosomes and zooplankton, such as phytoplankton abundance or water currents that may push certain species further from shore than others. I have begun to record the general density of visible zooplankton at depth during video analysis as a reference for myself and as a possible avenue for further research. With luck, some patterns will appear that relate environmental parameters to pyrosome and zooplankton abundance. In other news, the Charleston Marine Life Center research show case is scheduled for tomorrow at 11am and I have spent much of the day preparing a display for my project. My display will include some interesting footage taken from the July cruise, a jar of preserved pyrosomes for visual reference, and a pyrosome that I constructed out of thick plastic mesh and bubble wrap for tactile reference! I have found that an assumption many people have about pyrosomes is that they are very squishy and gelatinous, and while this is true of a pyrosome that is dead or dying, they are actually somewhat crisp and hold their shape well when they are fresh out of the water. ‘Sea Pickle’ really is a fitting name for them because they will crunch in a way that is distinctly reminiscent of a pickle when they are healthy. This is the sensation that I am attempting to capture with my false pyrosome as hopefully the plastic mesh will give people an idea of the solid but collapsible tunic of a real pyrosome while the bubble wrap will give a sense of their crunchiness as well as represent the zooids which compose the creatures. 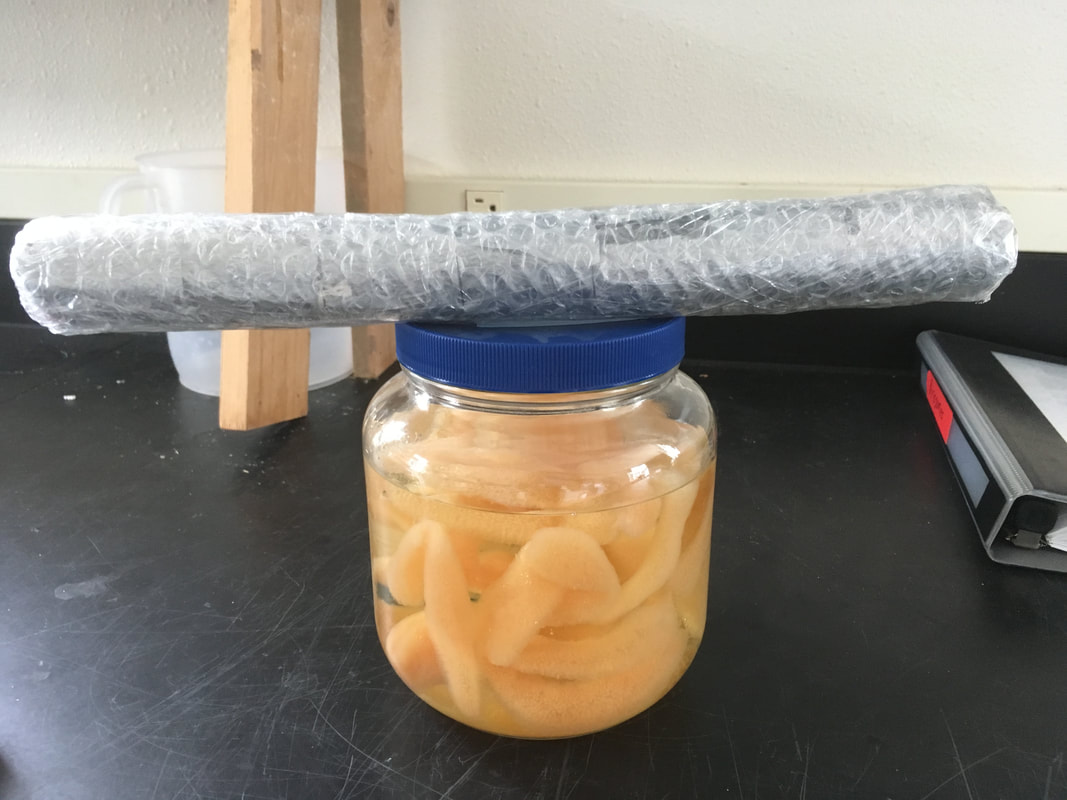 My constructed model pyrosome atop a jar or the real thing preserved in ethanol
|
AuthorHello there! My name is Matthew Gimpelevich and I am currently an undergraduate student in my third year of oceanography and engineering at Seattle Central College in Seattle, Washington. I’m lucky enough to be working in the Sutherland lab at the Oregon Institute of Marine Biology where I get to formulate my own methods of studying the pyrosome, Pyrosoma atlanticum, which has recently migrated up the Pacific coast from warmer waters! As an REU intern, I look forward to developing research techniques and methods of organizing and maintaining my own projects! Archives
August 2018
Categories |
 RSS Feed