|
This week has been one of the most interesting weeks of my project so far because I got to dig through my data to see what was hiding therein. I finished up my dataset at the beginning of the week, save for one experiment to account for the effect of gravity. This left me a lot of time to analyze the data, make plots, and draw conclusions. I’m happy to report that my data ended up looking great! The relationships that I was interested in all ended up being linear, which was consistent with my hypotheses. 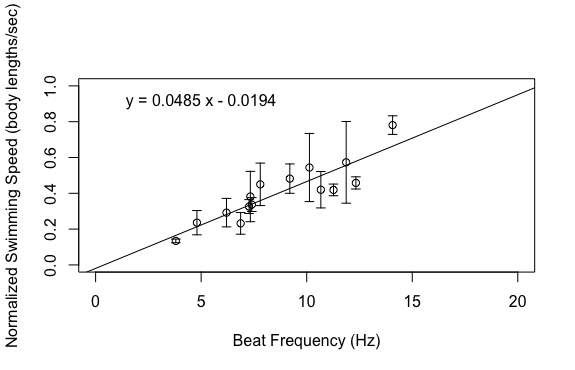 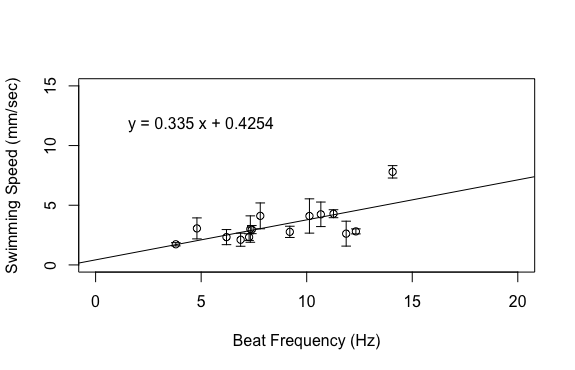 Based on the above graphs, beat frequency has a large effect on the swimming speed of the organism. As the beat frequency increases, swimming speed significantly increases regardless of whether body size was accounted for. However, the size of the organism does influence their swimming speed, as beat frequency is more strongly correlated to normalized swimming speed, meaning swimming speed divided by body length, than absolute swimming speed, which did not account for body size. This is consistent with previous results from Matsumoto 1991, but also shows that beat frequency is one of the primary drivers of swimming speed in these organisms. In addition to swimming speed, I was also interested in how different morphological features of these organisms change across their size range. I hoped that investigating these relationships would provide insight into the swimming speed trends shown above. As can been seen in the above graphs, as the body length of these organisms increases, a variety of metrics relating to ctene morphology significantly increase. These results may give some insight into why bigger organisms swim faster. Bigger organisms have longer ctenes, longer ctene rows, more space between the ctenes, more ctenes per row, and inflection points closer to the tips of the ctenes. These morphological features likely allow larger organisms to swim faster by allowing for increased power output of their metachronal waves compared to smaller organisms. It has been shown previously that increasing beat frequency leads to increases in power output of metachronal waves in Pleurobrachia (Barlow and Sleigh 1993, Dauptain 2008). My results, in combination with previous research, suggest that the above morphological features may play a role in the observed increase in power output, and subsequently the observed increase in swimming speed, as beat frequency increases. It would be interesting to quantify the relationship between swimming speed and these various morphological features.
I ran statistical analyses on all the above relationships and the slope of each regression line is significantly different from zero, which means that the increases in the independent variables, beat frequency and body length, do have a significant impact on the relevant dependent variables. These results are exciting for many reasons. For one, my experiment worked and I got good data! The results also support my hypotheses and there are a lot of implications that can be drawn from that support. Knowing how ctenophores like Pleurobrachia swim gives us more insight into how these organisms function as members of the planktonic ecosystem. I’m currently working through some papers that talk about the role of Pleurobrachia as a predator in planktonic ecosystems with respect to their influence on trophic structure. I think that my results will help give more insight into how Pleurobrachia have managed to have such a large impact on their ecosystem. I also think this provides evidence for a general trend in the plankton in which organisms modulate their swimming speed primarily through the beat frequency of their swimming structures. This is based on results from Murphy et al. 2011, which showed that increased beat frequency of krill pleopods led to increased swimming speed. It would be interesting to compare my results to the swimming performance of other ctenophores and other planktonic organisms that use metachronal swimming to build support for this general trend. My challenge now is to assemble all the plots and other figures I need to effectively convey my results. I will soon be making a poster in an attempt to summarize my project, which I know will be quite difficult. However, I am quite content at the moment as my project seems to have gone swimmingly. References: Barlow, D., & Sleigh, M. A. (1993). Water Propulsion Speeds and Power Output by Comb Plates of the Ctenophore Pleurobrachia Pileus Under Different Conditions. Journal of Experimental Biology, 183(1), 149–164. Dauptain, A., Favier, J., & Bottaro, A. (2008). Hydrodynamics of ciliary propulsion. Journal of Fluids and Structures, 24(8), 1156–1165. https://doi.org/10.1016/j.jfluidstructs.2008.06.007 Matsumoto, G. I. (1991). Swimming movements of ctenophores, and the mechanics of propulsion by ctene rows. In Coelenterate Biology: Recent Research on Cnidaria and Ctenophora (pp. 319–325). Springer, Dordrecht. https://doi.org/10.1007/978-94-011-3240-4_46 Murphy, D. W., Webster, D. R., Kawaguchi, S., King, R., & Yen, J. (2011). Metachronal swimming in Antarctic krill: gait kinematics and system design. Marine Biology; Heidelberg,158(11),2541–2554. http://dx.doi.org.ezproxy.library.wwu.edu/10.1007/s00227-011-1755-y
0 Comments
This week I have focused my efforts on analyzing the videos that I captured last week. I’m excited to see what knowledge can be gained from my data, but I must admit that going through almost four hours of footage was a bit draining. The protocol that I developed for analyzing the videos was straightforward, although it turned out to be time consuming. It took me a while to comb through each fifteen-minute video to find five periods in which the organisms were swimming so that I could perform my analysis. It also took a long time to calculate swimming speed. The method I used involved making a measurement of the position of the organism every so often during a three second swimming period, calculating the distance traveled between measurements, and then dividing that distance by the time elapsed. I was originally making a position measurement every 10 frames, but quickly realized that was going to take way too much time if I had to do it 75 times. I then changed my protocol to take position measurements every 20 frames, which sped up the process quite a bit and allowed me to analyze all fifteen videos this week. I also measured the length of each organism. This allowed me to normalize my swimming speed data since it is known that body size is positively correlated with swimming speed in Pleurobrachia (Matsumoto 1991). I have yet to run statistical analysis on my data, but based on some preliminary plotting I think that there is a positive, linear relationship between beat frequency and swimming speed but I’m not sure yet if the slope of the regression line is significantly different from zero. Out of curiosity, I used Excel to calculate the correlation coefficient, R value, for my data. R values can be used to assess the magnitude and direction of a correlation between two variables, but they are not indicative of a causal relationship. The R value for my data was about 0.89, which indicates that the variables are strongly correlated. 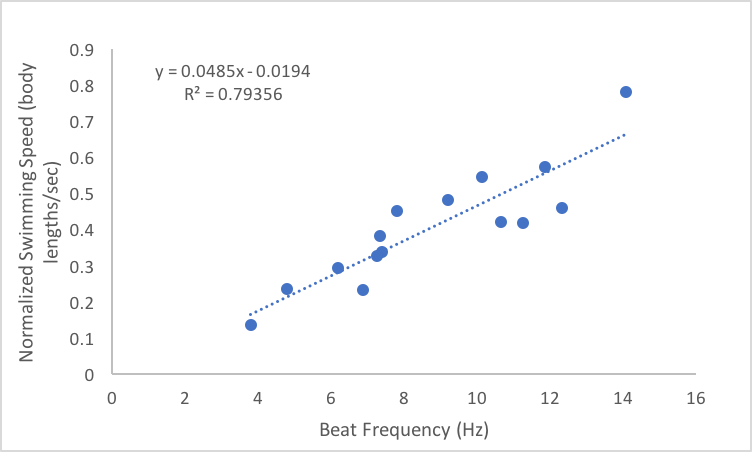 In addition to collecting data related to my main question, I also measured the average length of the ctenes for each organism and the average ctene spacing. This will allow me to assess how ctene length and spacing changes with body size, which may provide some explanatory information about the observed relationship between beat frequency and swimming speed. I also measured the average inflection point, the point at which the ctene bends, for each organism to gain further insight into how ctene behavior modulates swimming speed. I plan to continue making observations of ctene behavior to supplement my quantitative data as well as run my statistical analyses next week. Hopefully, I will be able to show you all my plots and other figures as well as let you know if my results are significant in my next blog post.
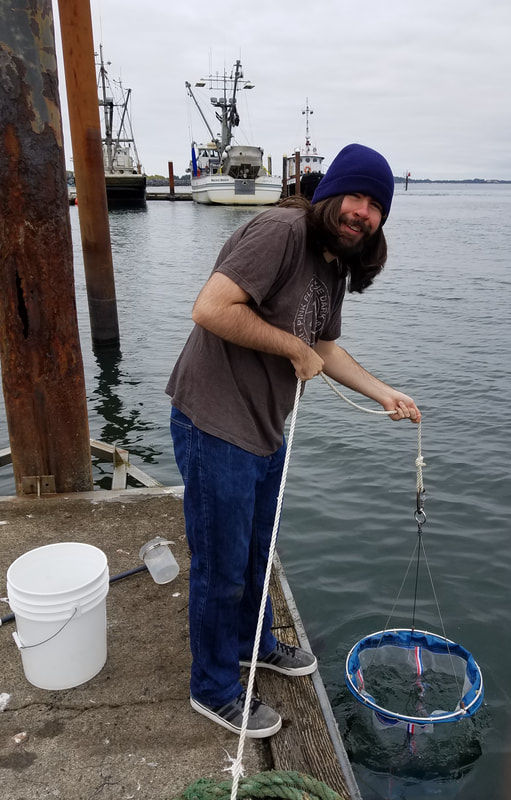
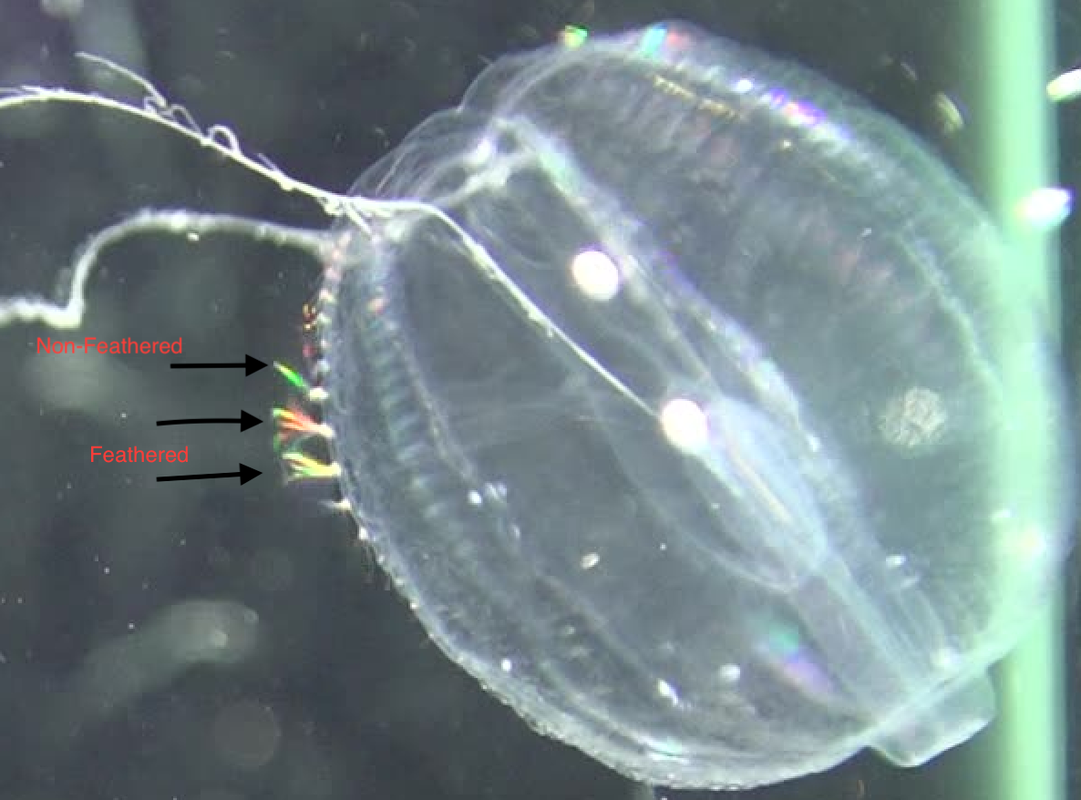
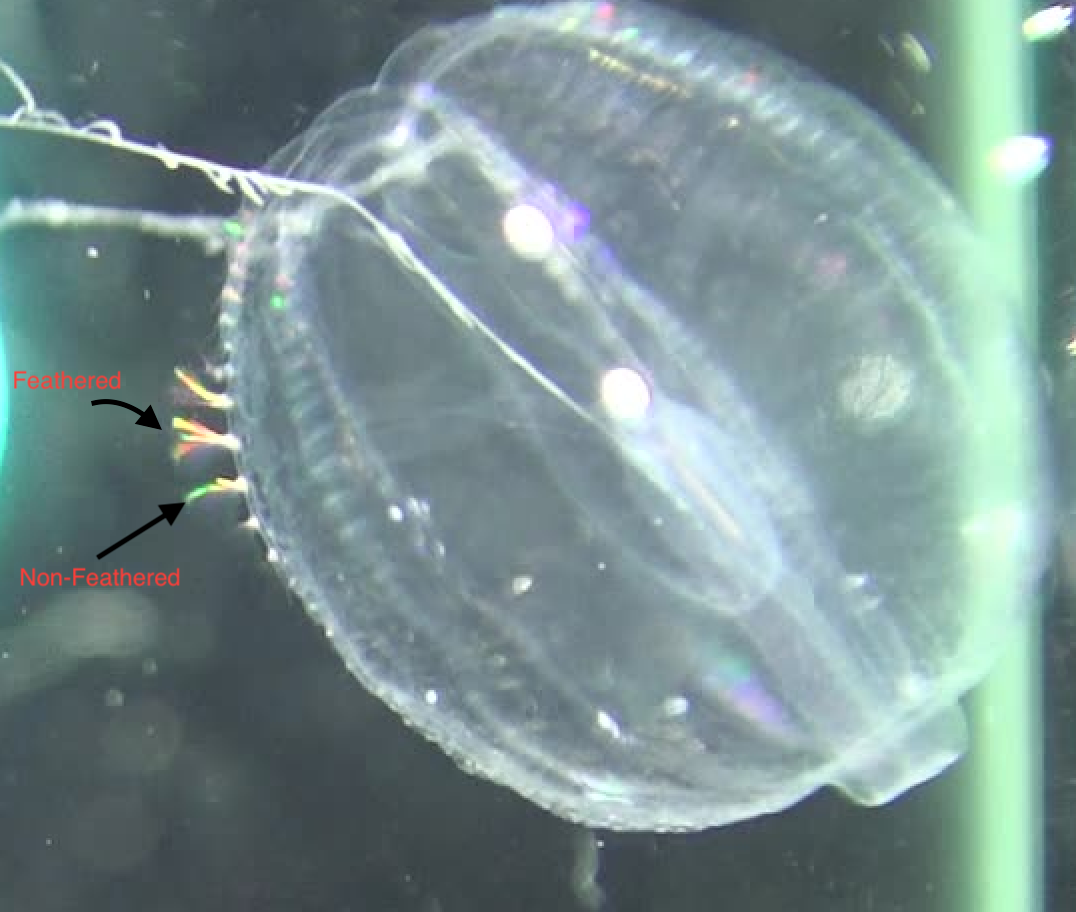
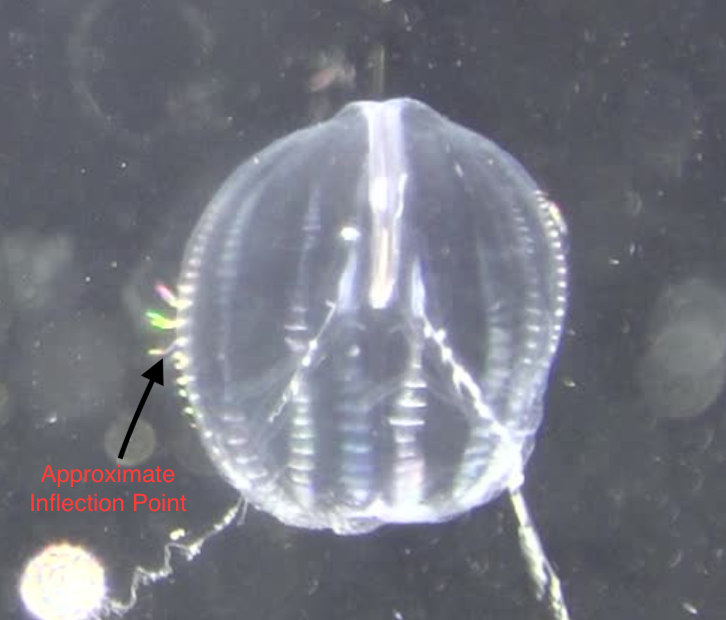
References: Matsumoto, G. I. (1991). Swimming movements of ctenophores, and the mechanics of propulsion by ctene rows. In Coelenterate Biology: Recent Research on Cnidaria and Ctenophora (pp. 319–325). Springer, Dordrecht. https://doi.org/10.1007/978-94-011-3240-4_46 I spent much of this week capturing video of Pleurobrachia. I ran into a slight road block early in the week when I realized that some of the Pleurobrachia I had collected where not in good enough shape to be videotaped. This was due to a large amount of parasitism by marine amphipods. I have since learned that there are two main species of amphipods that parasitize Pleurobrachia; Hyperoche mediterranea and Hyperoche medusarum (Laval 1980). I’m not completely sure, but I think the Pleurobrachia that I had were parasitized by H. mediterranea. I found that I could remove the parasites by careful pulling them off with forceps under the dissecting microscope, but this still left the parasitized jellies in bad shape. Of the five that were parasitized, only one retained its full swimming ability after the parasites had been removed. One died very quickly and the other three became largely inactive before eventually dying. This left me without four organisms that I needed to reach my intended sample size of 15 individuals. To remedy this, I went jelly fishing a lot this week. I learned from Marco, a Ph.D. candidate in the lab, that most jellyfish undergo a diurnal vertical migration in which they migrate to the surface at night. Therefore, I went fishing for jellies at night a few times this week and was able to collect the four Pleurobrachia that I needed. During these night fishing expeditions, I saw huge aggregations of another jellyfish called Clytia, which was amazing to witness.  In the end, I was able to collect video of all 15 Pleurobrachia in my sample this week, which is really exciting! Although, I am a bit sad that I won’t be collecting any more video of these wonderful organisms as I have quite enjoyed watching them swim. The next steps for me will be to collect raw data from all 15 videos, which I have already started, and then process that data to get the values that I can make into plots and other figures. Collecting raw data from the videos can be quite time consuming, especially the swim speed data, but I am hoping to get the data processed by the end of next week. If all goes well, I’ll soon be running statistical analyses on the data and will have some cool graphs to show y’all. The data for my main question is coming along nicely, so I’ve been able to start working on some of the sub questions that I am interested in addressing during my project. In addition to looking at how beat frequency affects swimming speed of Pleurobrachia, I also want to address whether the ratio between body size and the length of the ctenes, as well as the ratio between body size and the spacing of the ctenes, is consistent across the size range of these organisms. I have been measuring the body length, the average length of the ctenes, and the average ctene spacing for each organism in an effort to investigate that. I think this data will give some valuable insight into how Pleurobrachia are able to maintain swimming performance across their size range. I am also interested to see whether there is a consistent inflection point on the ctenes and how the feathering of the ctenes contributes to swimming performance. I have been collecting data on where the average inflection point occurs, as a percentage of total ctene length, for each organism. I also have been collecting stills of ctene feathering over the course of a beat to illustrate my descriptions of that aspect of ctene movement. Top Row: Stills showing how feathering of the ctenes changes over the course of a beat. Bottom Row: Stills indicating approximate inflection points on two ctenes. Furthermore, I am interested in collecting some observational data about how the ctenes behave during forward swimming, reverse swimming, and turning. There isn’t much in the literature that describes how the ctenes move during the various swimming behaviors of Pleurobrachia so I hope to describe that aspect of their swimming in detail. Thanks for following along with me on this journey so far. I have made a lot of progress during this past month and I’m excited to start sifting through my data to see what I can learn about Pleurobrachia swimming performance. References:
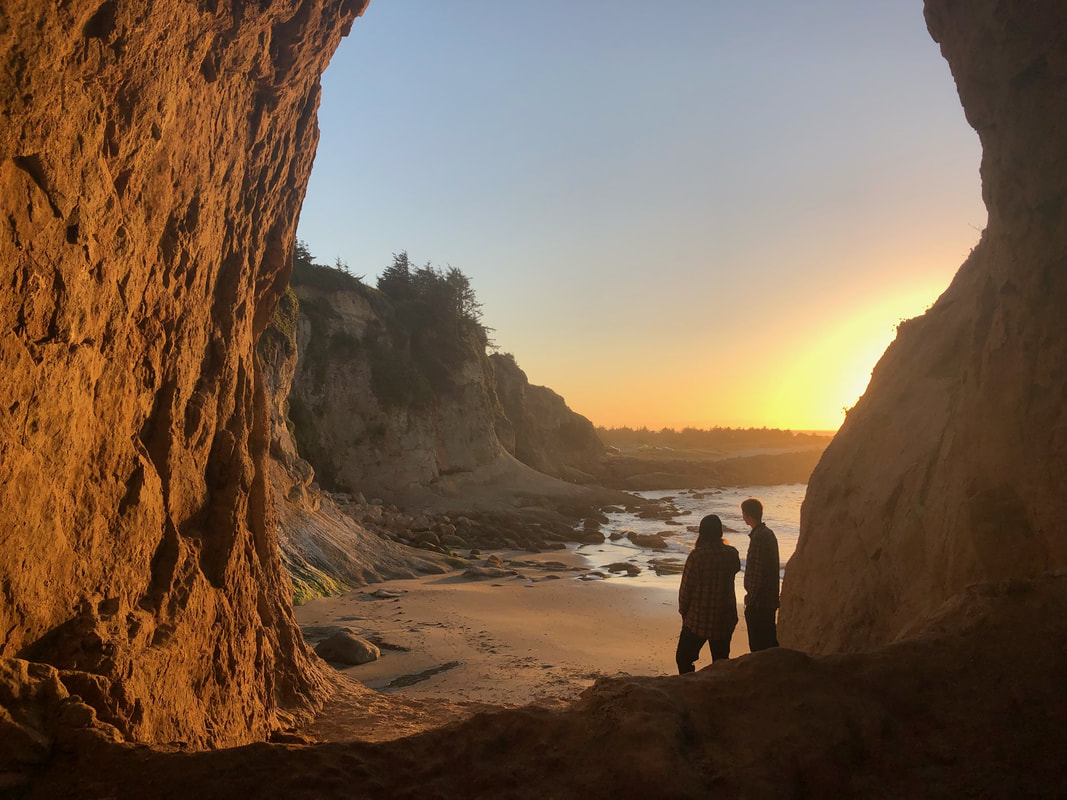
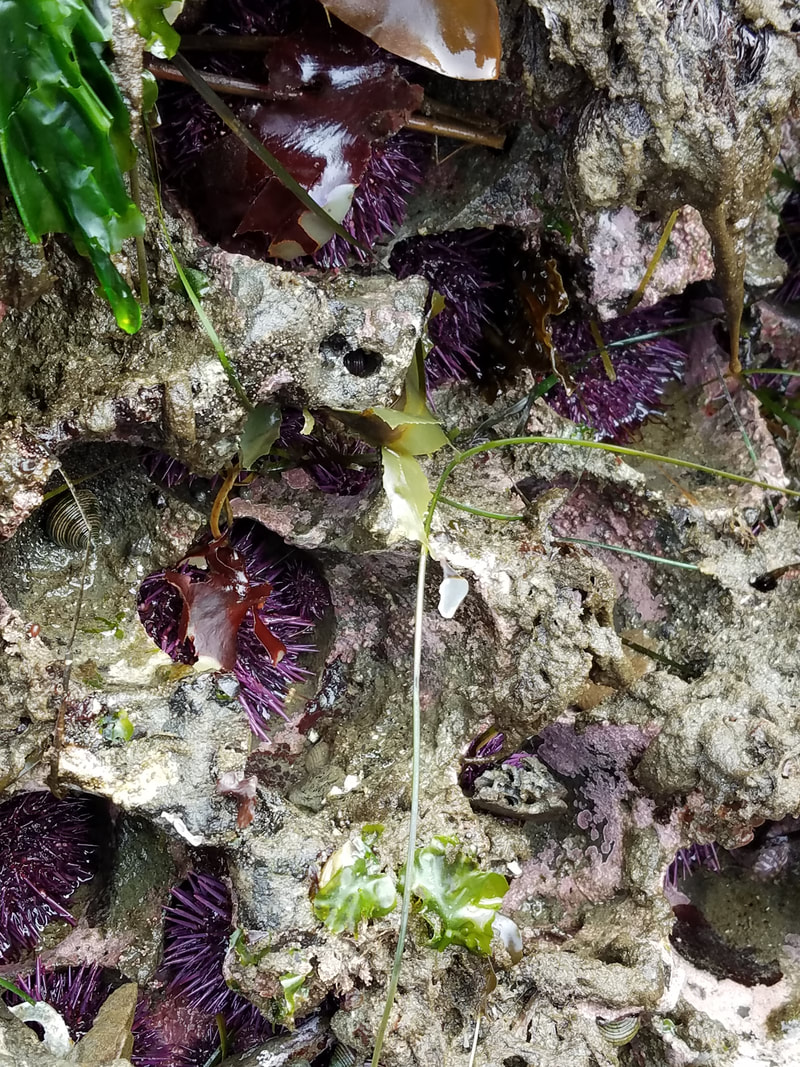
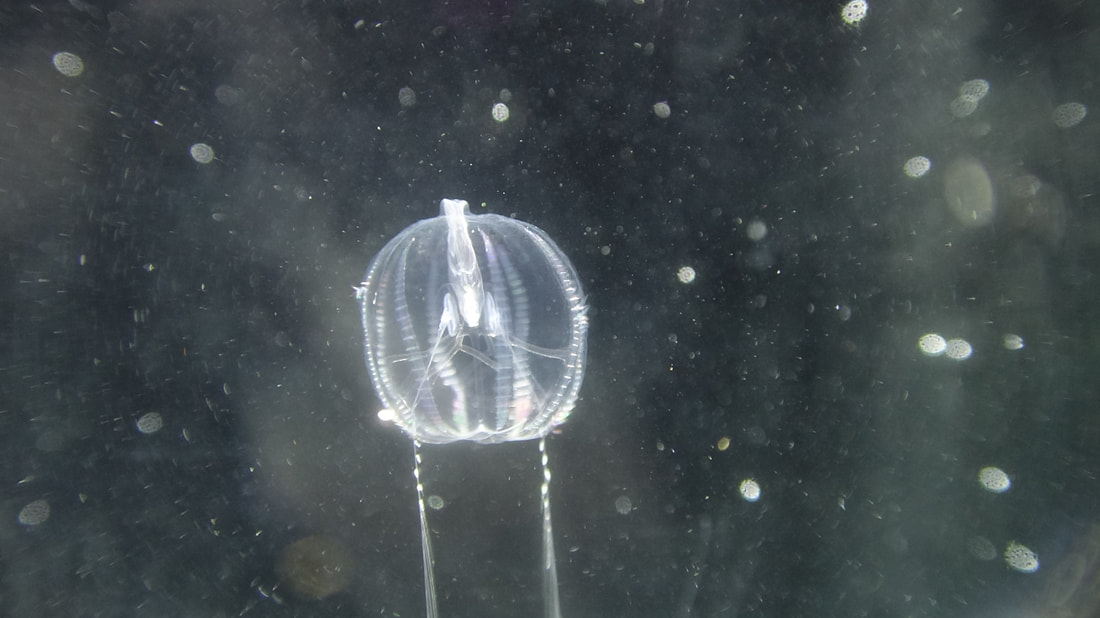
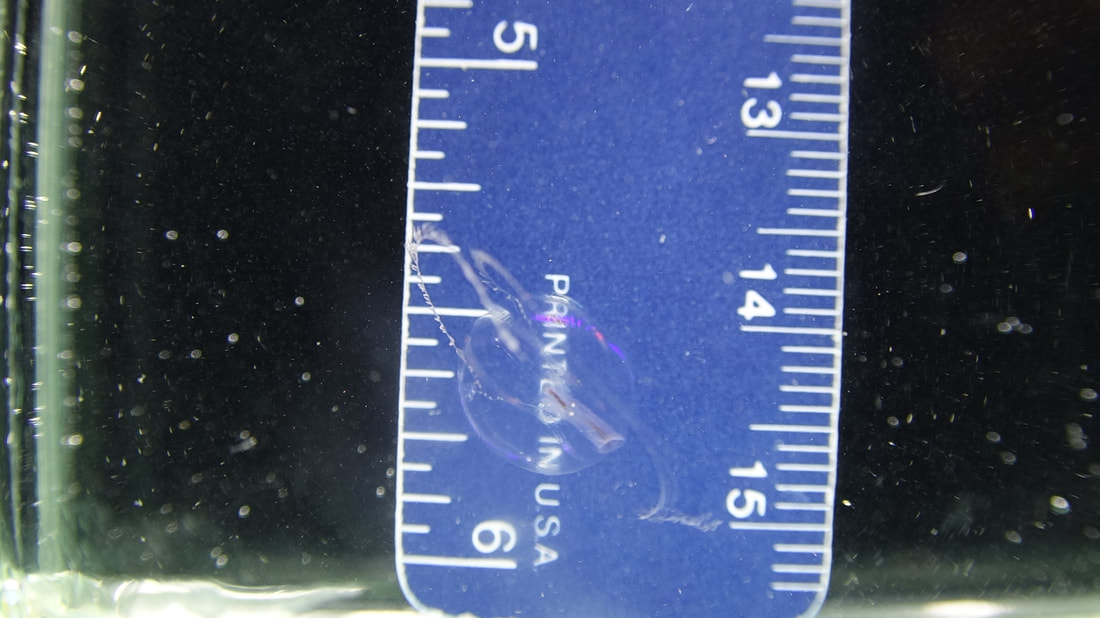
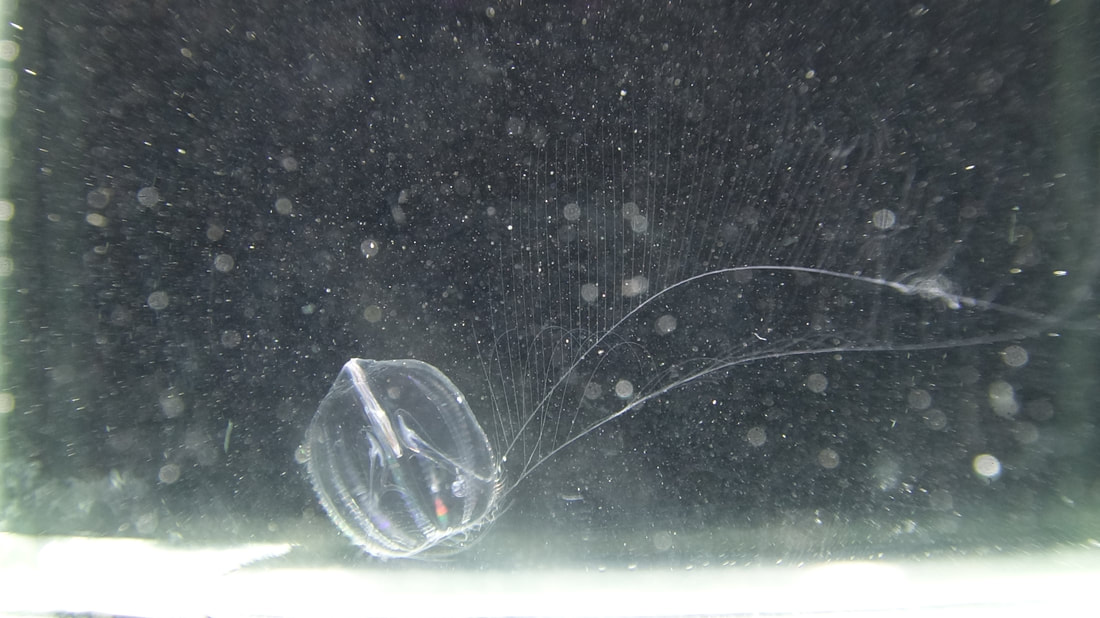
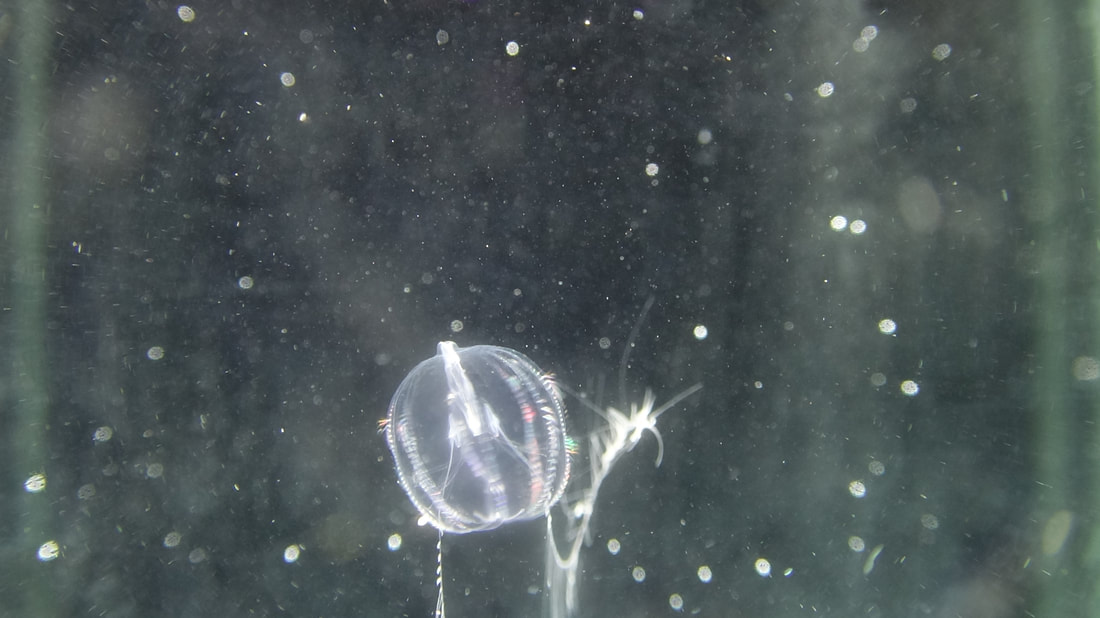
Laval, P. (1980). Hyperiid Amphipods as Crustacean Parasitoids Associated with Gelatinous Zooplankton. Oceanography and Marine Biology: An Annual Review, 18(1), 11-56. One third of my time here at OIMB has now passed. As this week comes to a close, I find myself reflecting about the first three weeks of this program. So far, this has been an amazing experience. I have learned so much about what it means to be a researcher, met some incredible people, and developed my knowledge of marine biology, especially with respect to gelatinous zooplankton. I have quite enjoyed doing research thus far, which is encouraging since I plan to pursue biology research and teaching as a career. However, I’ve had to come to grips with the fact that science takes a long time and nothing works perfectly the first time you try. I spent the beginning of the week finalizing a protocol for analyzing high speed video. I also spent some time mapping out my research project so I have a sense of every piece of my project and how they all fit together. With my protocols in place and my setup finalized, I was in a position where I could start to collect data! I first did a few dry runs of my protocols to see what needed to be refined. I quickly found out that Pleurobrachia are not the most active swimmers. My setup and video capture protocol seemed to be fine, but I had a hard time collecting video of Pleurobrachia swimming. The jellies would often hover at the top or bottom of the tank for long periods of time without swimming. 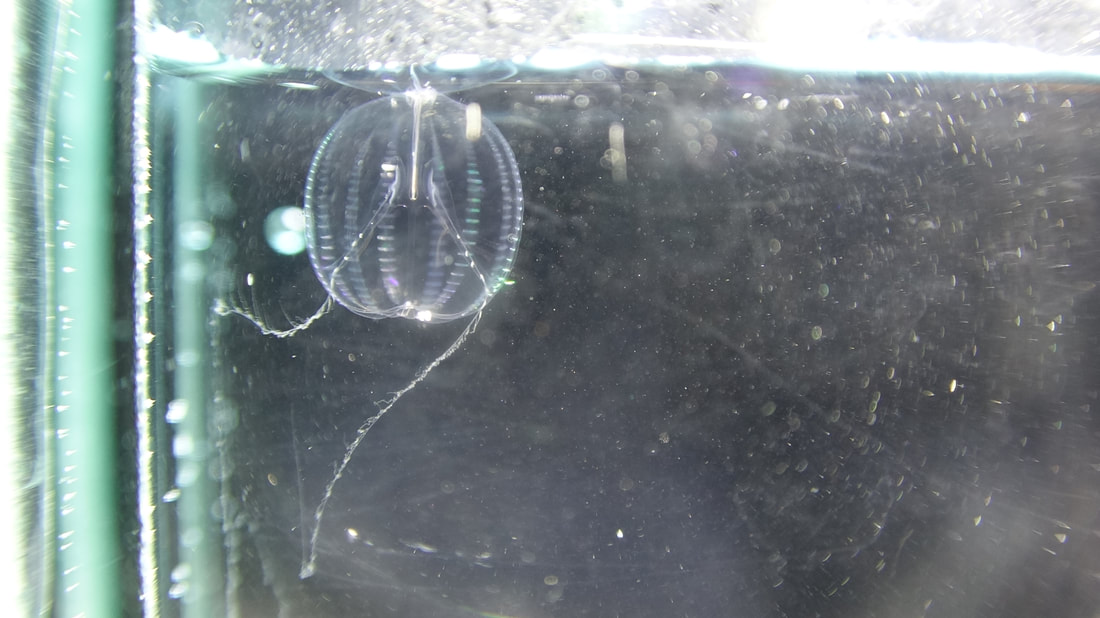 This made it difficult to test my video analysis protocol and induced some anxiety about how long it would take to collect all the data I need. However, I was eventually able to work through this speed bump. I found a pretty consistent method for prompting the jellies to swim. This method involved picking up the tank and walking to the other side of the lab and back. The motion of carrying the tank seemed to consistently prompt swimming behavior from the Pleurobrachia. When the organisms hovered at the top of the tank, I tried carefully pushing them down to the center of the tank with a paintbrush, which also resulted in swimming behavior. In some cases, the Pleurobrachia started swimming without my prompting after a long time in the tank, and thus I realized that simply waiting for them to swim is also an option. These discoveries allowed me to refine my video capture protocol to account for the behavior of the jellies. I was then able to capture some test video of the jellies and refine my video analysis protocol. Once I had refined both protocols, I moved on to collecting data. I collected raw data from 2 of 15 Pleurobrachia at the end of this week. If everything goes well, I should be able to collect data from the remaining 13 by Wednesday of next week. I feel good about the progress of my project so far and I am excited to collect more data. I’d also like to talk a little bit about social activities that I’ve been involved in here as I have done a lot more than just lab work. This past weekend we went camping at Sunset Bay and did some tide pooling at South Cove, which was incredible as I had never seen tide pools that extensive. On Monday of this week, two other interns and I went exploring and found this amazing hidden beach on the other side of a tunnel through the cliffs. This coming weekend, five of us will be heading down to the Redwoods to do some hiking and camping. I really enjoy spending time with my fellow interns; they are great people as I mentioned before. I’d like to leave you with a test video of one of the jellies that I shot at the beginning of the week. I hope you enjoy watching these wonderful animals as much as I do. I’d like to start this week by telling you a bit more about the details of my research project and the direction that it is currently heading. Last week, I mentioned that I would like to study to what extent the beat frequency of the comb rows determines the swimming speed of Pleurobrachia. I am interested in studying this primarily because it seems to be a fundamental aspect of this organism’s swimming performance, however, the previously published research on Pleurobrachia does not, to my knowledge, address this topic. How beat frequency affects Pleurobrachia at the level of the comb plates has been well described, for example we know the relationship between beat frequency and the angular velocity of a comb plate (Barlow and Sleigh 1993) as well as the relationship between beat frequency and the power output of a comb plate (Dauptain et al. 2008). However, I have not seen any empirical data that shows how beat frequency affects Pleurobrachia at the level of the organism. I hope to address this gap in the literature by assessing the relationship between beat frequency and swimming speed. This week I have been focusing on designing an experimental setup and protocols to address my primary research question. I have collected 15 Pleurobrachia using a combination of plankton tows and dipping them from the surface. They have since been living happily in the sea table in our lab. 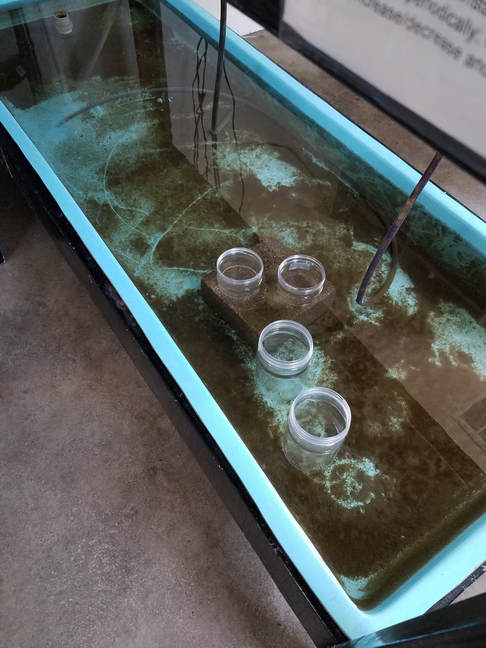 I am using what is called a dark field setup to take high speed video of my jellies. This setup involves a dark room and a camera pointed at a glass tank containing a solitary Pleurobrachia. Behind the tank is a light absorbing cloth and the tank is illuminated from the top by fiber optic lights. 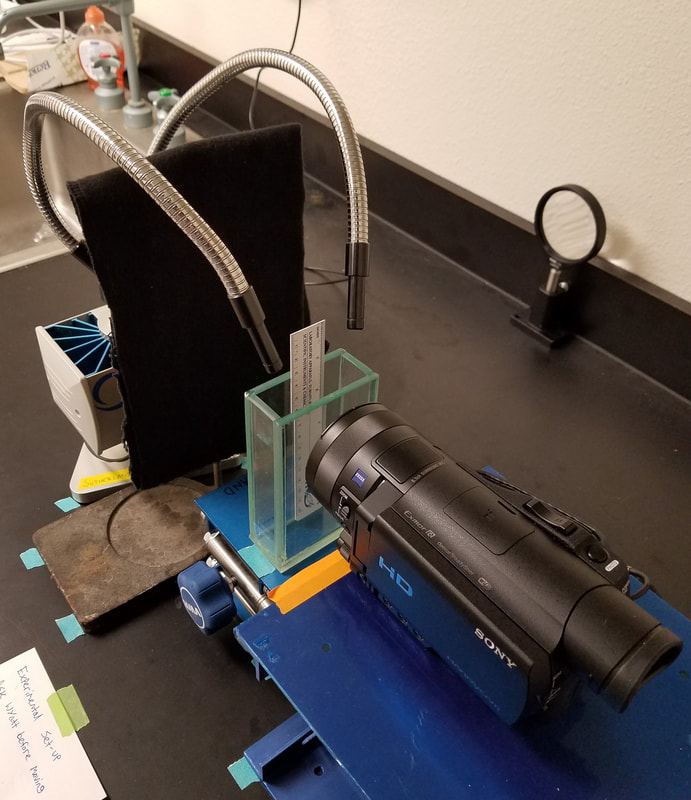 This allows the camera to capture a clear image of a translucent organism, such as Pleruobrachia. Using this setup, I can zoom in on the organism and take video in 60 frames per second that has a high enough resolution such that the comb plates are well resolved. I can then view the video frame by frame using a program called ImageJ. Viewing the video frame by frame allows me to manually count the beat frequency of the comb plates over a certain length of time. ImageJ also allows me to measure the dimensions of the organism’s body as well as the distance that the organism moves from frame to frame. Knowing the distance the organism moved between frames and the time between the frames gives me a measurement of swimming speed since velocity is simply distance over time. I am currently planning to take two 15 minute videos of each jelly that I have. Each video will give me 15 measurements of beat frequency and swimming speed, so a total of 30 measurements per organism. Now that you have the details, I hope you will enjoy looking at some test stills that I shot this week. The comb plates are iridescent, which makes these jellies look quite beautiful when they move. It’s hard to get a camera to focus on a translucent organism so please excuse any blur. References:
Barlow, D., & Sleigh, M. A. (1993). Water Propulsion Speeds and Power Output by Comb Plates of the Ctenophore Pleurobrachia Pileus Under Different Conditions. Journal of Experimental Biology, 183(1), 149–164. Dauptain, A., Favier, J., & Bottaro, A. (2008). Hydrodynamics of ciliary propulsion. Journal of Fluids and Structures, 24(8), 1156–1165. https://doi.org/10.1016/j.jfluidstructs.2008.06.007 |
AuthorMy name is Wyatt Heimbichner Goebel and I am a marine biology major at Western Washington University. I love biology, specifically marine mammal ecology and biomechanics. I’m always up for conversations about music, poetry, and weird biology facts. Archives
August 2018
Categories |


 RSS Feed