|
Welcome to week nine. I’m writing this after we’ve just finished our poster session and we’re all starting to pack. Everyone has suitcases in the hallway, those who have to fly are weighing their bags last minute to make sure they aren’t overweight, I made sure I have enough gas to at least get me to the nearest station. All the fun little errands to check off the list. 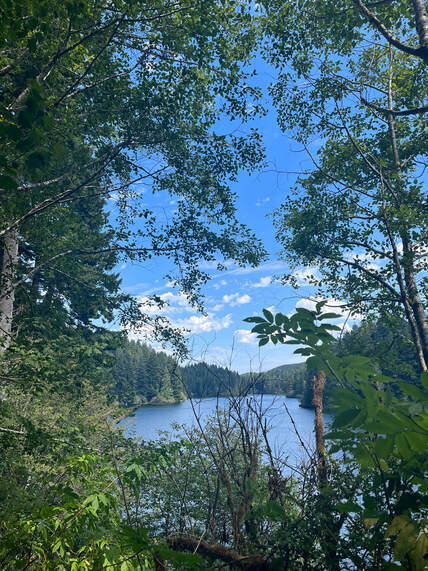 A photo I took on a hike at Eel Lake last week. The poster session went really well. So many people came that I felt like I was talking the entire two hours. I slowly felt myself becoming more comfortable giving my spiel over and over. I think I could recite it word for word on a whim’s notice now. I was so glad to see how many people were excited by our work. I was a little worried that my mainly methodological project and many complicated graphs would scare people off but everyone was willing to hear what I had to say. I felt a bit more confident in the work I did afterward and I wasn’t sure I would. So that’s great! Everyone else's posters turned out beautifully as well. Seeing all our hard work come to fruition was such a gratifying and exciting experience. 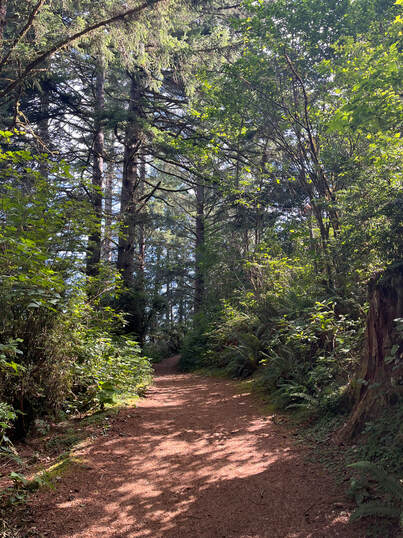 Another hike photo. On the personal side of things, we’re getting ready to go to a potluck at Richard’s house with all the REU’s and some of the mentors. I hear Richard is making tuna so I’m very excited about that. I think it will be a nice last get together before we head our separate ways. My time at OIMB has been unforgettable. Literally. Because I immortalized it in this blog. Thanks for reading!
1 Comment
Sometimes I feel like one of those dogs that can sense earthquakes before they happen. Except I am neither a canine nor a psychic because I can very clearly see and feel the end of the REU approaching. I remember reading the blogs of former interns before my initial interview last March and by the time I reached their week 8 posts they were usually feeling a little melancholy. I understand why. Suddenly all of the events that seemed so far off at the beginning are right around the corner. Our poster session is next Friday and the day after that we all leave. This week I submitted my poster draft for review and we had a peer critique session on Wednesday. I was so grateful for the feedback because after hours of staring at the same figure captions and resizing text boxes by a few millimeters every five minutes to try and make everything symmetrical, there’s only so much objectivity I can continue to hold about my project. Most of the edits I had to correct were about the explanations of my graphs. Since most of my project was data analysis the majority of my results were numbers that I dressed up and plotted against each other in various ways. However, converting numbers into words that effectively communicate their meaning is more difficult than I expected, so I spent most of my time workshopping different explanations of my figures that didn’t require my presence to understand them. 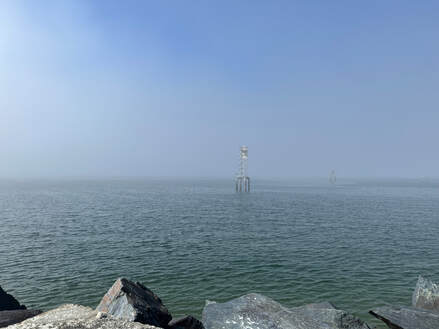 The view of the ocean from the jetty. I spent quite a bit of time sitting on the jetty this week. There’s this lovely little raised platform in the middle of it that’s very good for stretching out on. I saw a beautiful white crane, two seals, and a very excited puppy all in one jetty-sitting session. I don’t think I’ll ever get used to how gorgeous the scenery is here. Gargantuan pine trees grow out of the sand, random barnacles end up in the parking lot nowhere near shore. Sometimes I like to think of Charleston as its own little snow globe except instead of snow there’s fog. We had an all-hands meeting in Dr. Galloway’s lab this week and I finally got to meet everyone Aaron has taken under his wing. We each took turns explaining something that was going well and going poorly in our personal and professional lives. I found the whole thing very reassuring. Everyone experiences stress but excitement at the same time. I think it must be the nature of the field. I think I need to do some thinking about my future. 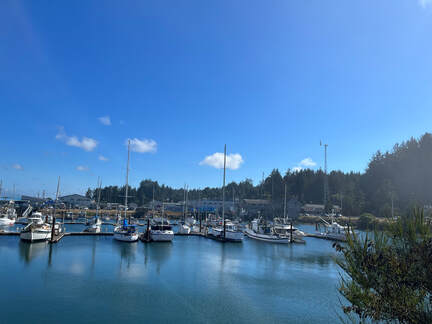 The view of the marina from the jetty. What to say about week seven. To start off, I need to stop joking that graphic design is my passion because I’ve been graphic designing all week and it definitely is not. Well, maybe it’ll turn out to be delayed gratification because when my poster is finally finished I think I will feel very relieved and accomplished and I’ll go right back to telling people that I was born to make posters. 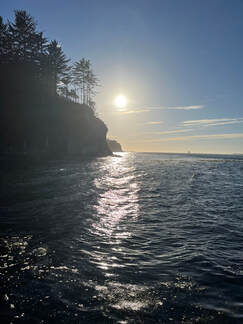 I'm going to miss the view from the jetty. So as you might have guessed this week was mainly spent creating figures out of my data and crafting my poster. I thought of a few interesting ways to model my data but I’m not sure which graphs will make the final cut. For one, I decided to graph the abundance of kelp in each video across a spatiotemporal axis. Which is a fancy way of saying time and space. The X-axis of the graph is the length of a single video in seconds, the Y-axis is the percentage of kelp present in the video. This way, the viewer can visualize what percentage of kelp appeared in certain segments of a video. The reason I decided to format the figure this way is because I think the density estimates as a single number, abundance per meter squared, is confusing. The value 1.7 bull kelp per square meter doesn’t tell you that 80% of the kelp in the video is concentrated in a six second segment and, in turn, a similarly small physical distance. In the same vein of analysis, I decided to calculate the percentage of each transect that is bare seafloor because I like the way those values contextualize the cold, unfeeling, density estimates in their raw form. 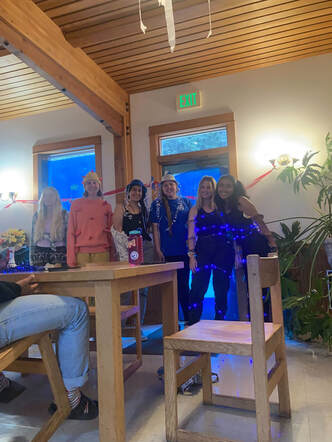 Annika, Colleen, Sherlyn, Chloe, Flynn, and I at the Invertebrate Ball. On the personal side of things, last week was the invertebrate ball! Flynn and I decided at the very last moment to try and transform into comb jellies. To do so we wrapped blue metallic streamers around our arms and fluorescent blue fairy lights around our legs. I was a little concerned our costumes would fall apart while we were on the catwalk but everything worked out. So many people put so much inspiring effort into their costumes I was very impressed, it made me feel better about my own haphazard attempt. I like the community here because of experiences like that. I still can’t believe we only have two weeks left, I’ll try again next week.
This is the end of week six and I am practicing the very thoroughly researched, corroborated, and peer-reviewed technique called denial. Only three weeks left on the horizon and I don’t know how to react. On one hand I am definitely feeling the familiar, “I think I’m ready to take my last exam and do my final project and then sleep for a week straight” ache that I usually experience at the end of a semester. But the difference is I can whine about all of that with the comfort of knowing I’ll be back at school for another term in a couple months. I might never come back to OIMB. I might never see these hundred foot pines at the base of campus on my walk home from lab, never watch the fog roll in in real time from my window, never wander down the jetty shivering because I forgot a jacket again. So it’s different. More precious, I think. 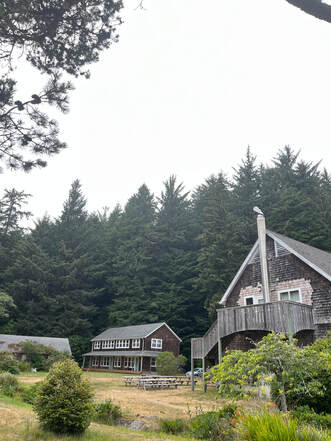 My favorite view on campus. That’s quite enough catastrophizing for now, there’s still three weeks left! In terms of science, this week was fairly standard. Just before Dr. Galloway departed for a diving trip last week he gave me access to a new collection of diving footage. These videos were taken locally at Cape Arago last year, and this week I analyzed all twenty for kelp density. I was surprised that I managed to do almost double the amount of work I did for the last set of videos but I suppose I was feeling productive. Next week I’ll work on making figures from the new data and perhaps look into a comparison between the two data sets. 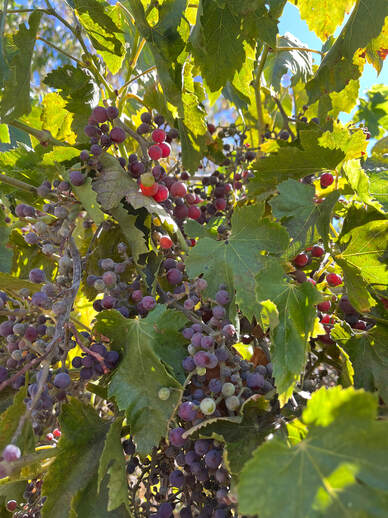 Some wild grapes that grow by my house. In a personal turn of events, I went home last weekend. My mother’s birthday party was on Saturday, so on impulse I flew home with Flynn and Ytxzae to attend. I should mention “home” for me is Sunnyvale, CA. While we were there we visited San Francisco and explored for a while. The Golden Gate Bridge was as cherry-red as always and the wind was as obnoxious as I remember. Seeing my family for a few days was truly lovely. On Sunday we drove back up to Oregon and passed through the redwoods in Humboldt and the coast just beyond them. The whole thing was gorgeous and mind-numbing and memorable to say the least.
I think that’s all for now. Week five has come and gone and we are officially over halfway through the REU. I’m convinced time is thinner on the Oregon coast because it’s so easy to slip through three days and not even realize it until you’ve checked your calendar. This week brought some unexpected twists and turns. First of all, I finished my kelp density estimates for all fifteen videos and created a couple figures to model my results. At the first two sites in Haida Gwaii there were a range of 1.3-1.5 kelp stipes per square meter. At the third site there were closer to 2 stipes per square meter. And there were 0 stipes at the final two sites. Zero as in, I watched all four videos the prescribed three times and not a single stipe appeared in frame the entire time. I wasn’t sure what to make of this result but Dr. Galloway seemed excited by this revelation! Speaking of Dr. Galloway, he very generously offered to let me help with a project in the lab this week. He needed to collect some data on the calories present in red sea urchin gonads (reproductive organs) and set about doing so mid-week. With the help of another grad student, we created a makeshift assembly line in which I would record the dimensions of each whole urchin, Dr. Galloway would crack the urchin open and dissect out a gonad, I would record the wet mass of the gonad, and then a sample of a different gonad would be stored for testing. 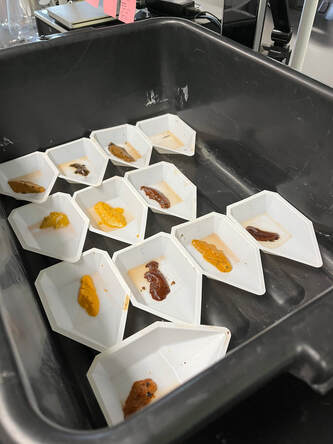 Urchin gonads before the drying oven. We harvested thirteen gonads in total and put them in the drying oven for 48 hours before I went back to collect them and record the dry mass of the gonads. The alternate samples were put in a freeze dryer and then ground up and compacted into pellets to use for analysis in the bomb calorimeter. A bomb calorimeter is, in a word, sorcery. Well no, it’s actually an instrument in which you can put a dry sample of some substance into a metal capsule (the bomb), pressurize the capsule with 100% oxygen, combust the sample until it is entirely consumed, and then derive how many calories the sample contained from the energy released by the combustion. Also, they don’t tell you this in the manual, but you can only use the calorimeter during a full moon, you have to sacrifice a lock of your hair into the bomb, and you have to perform some sort of pagan-sounding chant before you turn it on or else it won’t work. 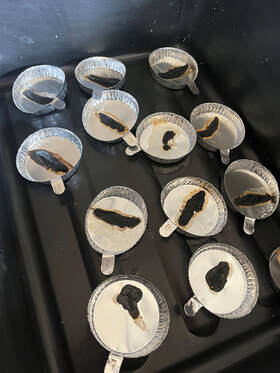 Urchin gonads after the drying oven. Anyway, the urchin project was both an extremely fun and informative side-quest this week and I’m so glad I was able to participate! I think I’ll spend the next week planning my poster and working on a new set of kelp videos. See you then!
Welcome to week four! As I’m writing this my hair is still wet from the shower I took after a long morning of tide-pooling. We left for Qochyax Island at seven fifteen this morning because that’s when the tide was lowest. During a low tide you can scramble down the cliffside along Sunset Bay and walk to the island, although it’s important to keep an eye on the time because if you leave too late the tide will have returned and you’ll be swimming back. We saw several cool creatures including the tiniest little nudibranch (I’m forgetting which species, my apologies) and more purple urchins than I knew how to comprehend. 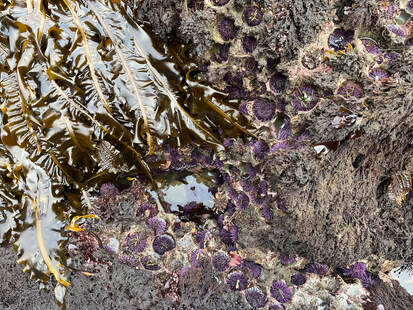 A bed of purple urchins. On the academic front, I submitted my proposal this Tuesday and began to work on my proposal presentation for next Tuesday. I’m so excited to hear what everyone has been working on these last few weeks in their respective labs. I also finished pulling stills from the Haida Gwaii videos and formatting the file names for every screenshot into my excel spreadsheet, which is now 271 cells long. I think I’m beginning to earn the “Microsoft Excel” qualification on my resume. I then calculated the mean widths for each set of stills and the standard deviation between each width measurement. After speaking with Dr. Galloway we’ve decided that a quick way to get a sense of how significant the difference between the width mean for 10 stills versus 20 stills is a two sample t-test. This means that after conducting the test, which compares the mean of two data sets, if the resulting value is greater than 0.05 then there is no significant statistical difference between each mean, and possibly, no reason to collect 20 stills versus 10. However, if the t-test value is below 0.05, there IS a significant difference between each mean and I might wonder if I need to collect even more stills to paint an accurate picture of the contents of each video. 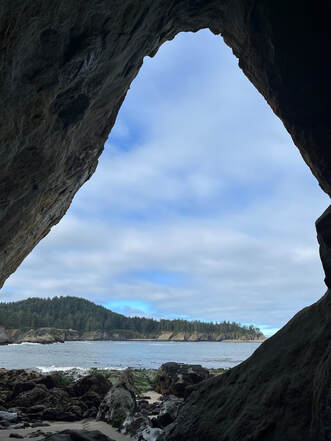 Sunset Bay from inside a cave. So far my results have been well over the 0.05 threshold, ranging from 0.5-0.7, so it seems like if nothing else my data is consistent! Could be consistent and wrong, but consistent nonetheless! In addition, I counted the visible kelp in each video three separate times and began doing the density calculations (kelp abundance/area in m2). I’m still working out how many significant digits I want to include in my final density-estimates so I’ll share some more results next week. Finally, and possibly most importantly, it’s time for a round rock update!!! [pause for applause, cheering, excited utterances etc.] On Wednesday after Ytxzae and I finished a run we decided to wander down to the OIMB beach during low tide and lo’ and behold, nestled in the rocks where we left it behind last time was The round rock. We still have not decided what to do with it but after several more people suggested that we break it open in hopes of finding a highly unlikely geode or try leaving it in water overnight to see if it disintegrates, the rock has been relocated to the floor of my dorm room for the time being. It is quite an effective door stopper I must say. 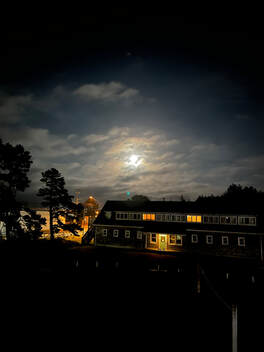 OIMB campus at night with a full moon. That’s about all I can think of to update this week but there are plenty more exciting things to come. Talk to you then!
What to say about week three. I suppose I’ll start at the beginning. Monday was the fourth of July and we had a delicious picnic on campus with all the interns and UO students and some of the mentors and professors. I ate a few of the freshest oysters I’ve ever had given that they were harvested from the ocean across the street (have I mentioned how much I love having an ocean across the street?) and played some friendly volleyball with the other interns. I only hit the ball into the creek once and it was hot enough that it dried almost instantly. The rest of the afternoon I spent swimming with Ytxzae and hanging out on the jetty with Flynn and it was all very pleasant and relaxing. 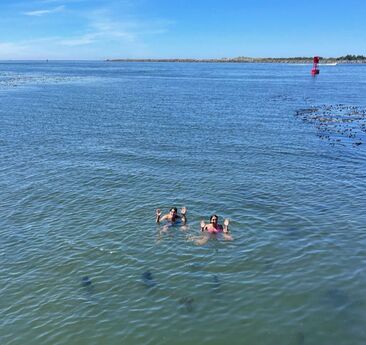 I spent most of the work week prodding at my methodology and praying there were no design flaws. Some of the details I mulled over were: how the depth of the diver’s position affects the size of the scale, if pulling stills every fifteen seconds provides enough data to resist the skew of outliers, and how to ensure I’m only counting kelp within the approximated rectangle of the diver’s course. First, I decided to write-off the depth of the footage off-bottom as a random effect of my model because I’m only going for a flat-bottom estimate, meaning the survey is 2-D. The height of the diver's vantage point should not matter because the size of the laser scale adjusts proportional to its distance from the sea floor. Second, I’ve decided to calculate the width means and standard deviations for the original ten stills AND for an expanded data set of twenty stills per video, in order to compare the values and assess both precision (the similarity of the values to each other) and accuracy (the difference between the experimental widths and the actual width of the transect). Precise values would look like: 1.2, 1.3, 1.2, 1.1, 1.2, while an accurate value would be 1.2 if the true width of the transect was also 1.2. And finally, since I am manually collecting still images I have some agency in where/when I take a screenshot. I’ve decided that I’ll only capture a still when the diver is looking straight ahead and not at a random point off to the side, to prevent collecting a width that does not fall within the sample boundary. 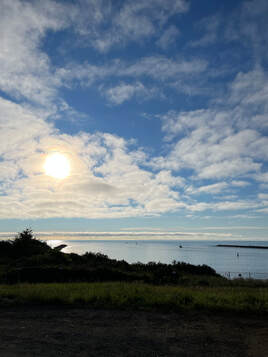 Have a look at this nice view while you take your deep breath. I just took a very long and deep breath after typing all of that out, please feel free to take a deep breath with me as you have just read everything I typed out. Many thanks.
Well, I’ve embarked on some revisions to my project so I think I’ll spend the next week doing a little more cleanup and hopefully start sharing some results! With the arrival of Week Two I am feeling simultaneously excited and uncertain. On Monday I spent much of my time watching and rewatching a batch of thirty videos collected from Dr. Galloway and his team’s diving trip to Haida Gwaii in 2021. Each video belongs to one of three transects. The first transect spans between the shore and a depth of 10 meters, the second extends to a depth of 20 meters, and the third reaches 30 meters deep. A diver covers 30 meters (in length) of footage per video from two vantage points. The first is a benthic perspective that captures the seafloor along the transect and the second is a pelagic view facing upward toward the surface. Ultimately, these videos and our investigation into underwater video surveying aim to pin down some standard practices for monitoring the health and species composition of kelp forests. Bull kelp (Nereocystis luetkeana) in Pacific Northwest kelp ecosystems have declined by nearly 90 percent since 2014 for a myriad of reasons. These include Marine Heat Waves (MHW’s), which disrupt the distribution of nutrients along the coast, and Sea Star Wasting Disease, which wiped out the majority of sea urchins’ natural predators and in turn facilitated the formation of urchin barrens. For the restoration of bull kelp to transpire we need to develop viable methods of monitoring the status of the ecosystem to oversee the process. 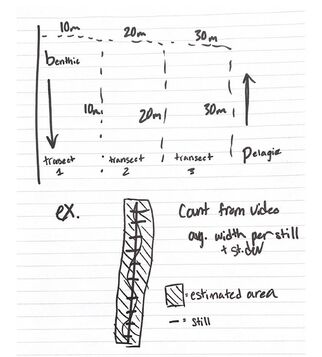 An attempt at a diagram of the video content described above. This is where my individual research slots in. I will attempt to calculate a flat-bottom density estimate of bull kelp present in the Haida Gwaii videos. The methodology is fairly simple. For each video I will pull a still image every fifteen seconds, this works out to about ten stills per video. For each still I will digitally create an 11 centimeter scale helpfully provided by two lasers projected from the diver onto the seafloor and kept constant for the duration of the dive footage. I will use the scale to measure the width of the visible transect and then average the widths I collect from all ten stills. Using the 30 meter transect length and the approximated width to find the area of the transect, all that’s left to do is count the bull kelp from the same video and determine how many bull kelp are present per square meter! So basically when I swore I would never use geometry or statistics in “real life” it was a blatant lie. Suddenly standard deviations are an uncomfortably common occurrence in my day-to-day. 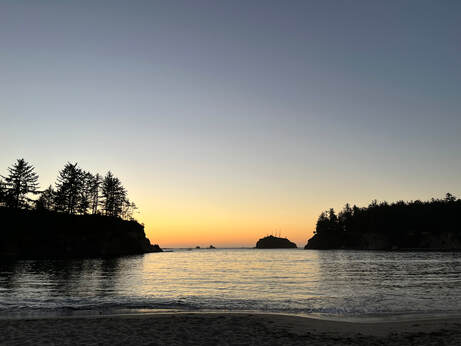 The beach at sunset. On the social side of things, last weekend we took an REU camping trip to Sunset Bay State Park. I learned several important life lessons: 1. You can make an incredibly successful s’more with a Crunch bar or Butterfinger, 2. Crows are capable of being extremely loud especially when they band together and chorus at five AM. I understand why a group of them is called a “murder” now, they genuinely sounded like they were committing a felony, 3. The sunsets in Oregon are gorgeous when you watch them from the shore, 4. The Pacific Ocean is so cold. I already knew that but reiterating it gives me validation.
Overall, I had another spectacular week at OIMB and I’m excited to start working on my proposal this weekend to hopefully kickstart another! Today is Friday June 24, 2022 and this marks the last day of my first week at OIMB! When I flew in last Saturday I wasn’t sure what to expect. I knew I’d reread the suggested packing list at least six times and still managed to forget a towel until ten minutes before heading to the airport; I knew there would be other interns but I didn’t know they would be so lovely and welcoming; I can point out the Oregon coast on a map but I didn’t know how gorgeous it is in person! It’s safe to say that so far my experience has been all-around positive. The first morning after the REU’s arrived I heard the meal-time bell at 7:00 AM for the first time. I imagined waking up for breakfast would be more difficult but the sun rises at around 5:30 here so I’ve been waking up alongside it most days. A highlight of Day One was when we took a group trip to explore the OIMB beach and discovered an almost perfectly round rock. We’re not sure how its existence came to be but after a quick debate on whether to try and crack it open (mere minutes after finding it I might add) we decided to leave it behind. If we ever manage to go back and find it again I’ll be sure to update the status of the rock here. We spent the rest of our free time playing basketball, and ping pong, and doing a little bit of picturesque hiking. 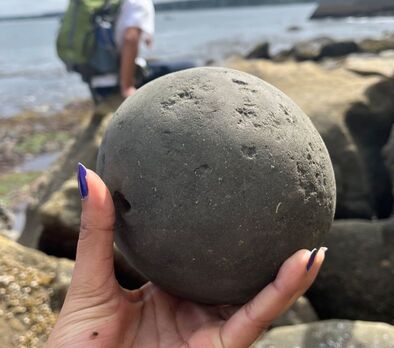 The "round rock." Switching gears, I was introduced to my lab partner for the summer, J’mie, and our mentor Dr. Galloway. Our first project was to sort through about 600 stills captured from diving footage collected along the benthic zone of the island Haida Gwaii, and record the number of sea urchins present. The purpose of this project is to test the feasibility of analyzing video data as a method of surveying the species present in a kelp forest. As J’mie and I count the urchins we also record the time it takes us to complete each set of images, and in the future we will compare our results to gauge our accuracy. 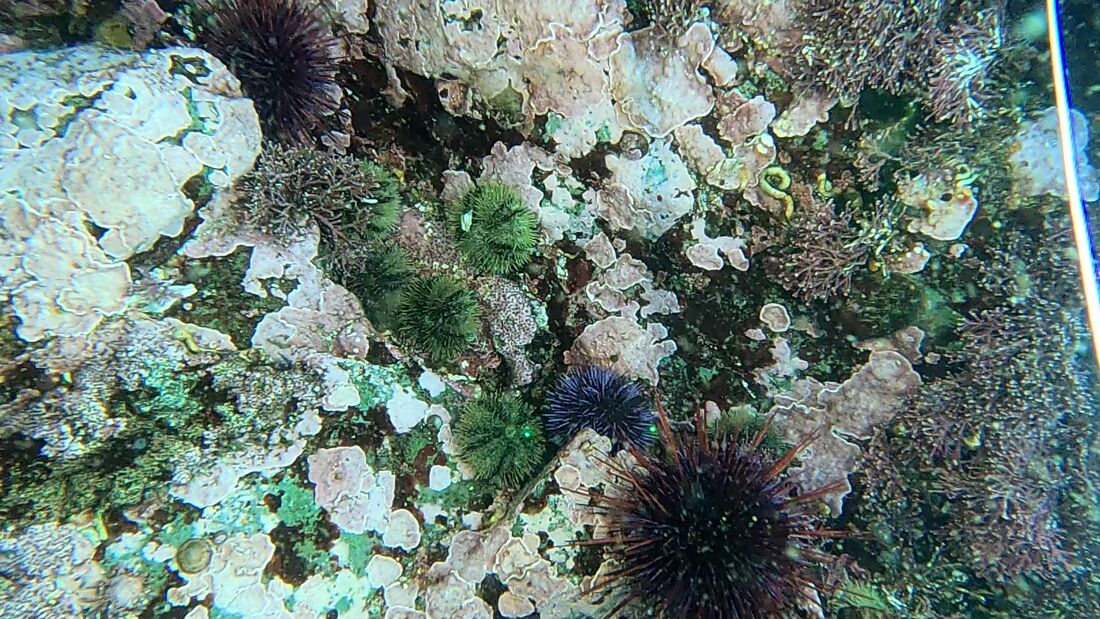 Photo by: Aaron Galloway. There are six Green urchins, two Red urchins, and one Purple urchin pictured above. There are three species of urchins in the photos so I’ve spent the last couple of days getting comfortable telling them apart. The first is the Purple urchin, (Strongylocentrotus purpuratus), which are the rarest in the data set and have the most uniform spines. The second is the Red urchin, (Mesocentrotus franciscanus), these are the most common and have the longest and most irregularly patterned spines. The third is the Green urchin, (Strongylocentrotus droebachiensis), these have the shortest spines and sport stripes along their test (the central body of an urchin). I finished sorting through the urchin images yesterday and today I’ll work on developing my individual project that I will derive from a facet of the diving data set we already have!
|
AuthorHello! My name is Catalina, welcome to my blog! I am a rising Junior at NYU pursuing a degree in Biology and I'm from Sunnyvale, California. This summer I am working in Dr. Aaron Galloway's Coastal Trophic Ecology (CTE) lab developing video survey methodology applied to kelp forest monitoring. Thanks for reading! Archives
August 2022
Categories |
 RSS Feed