|
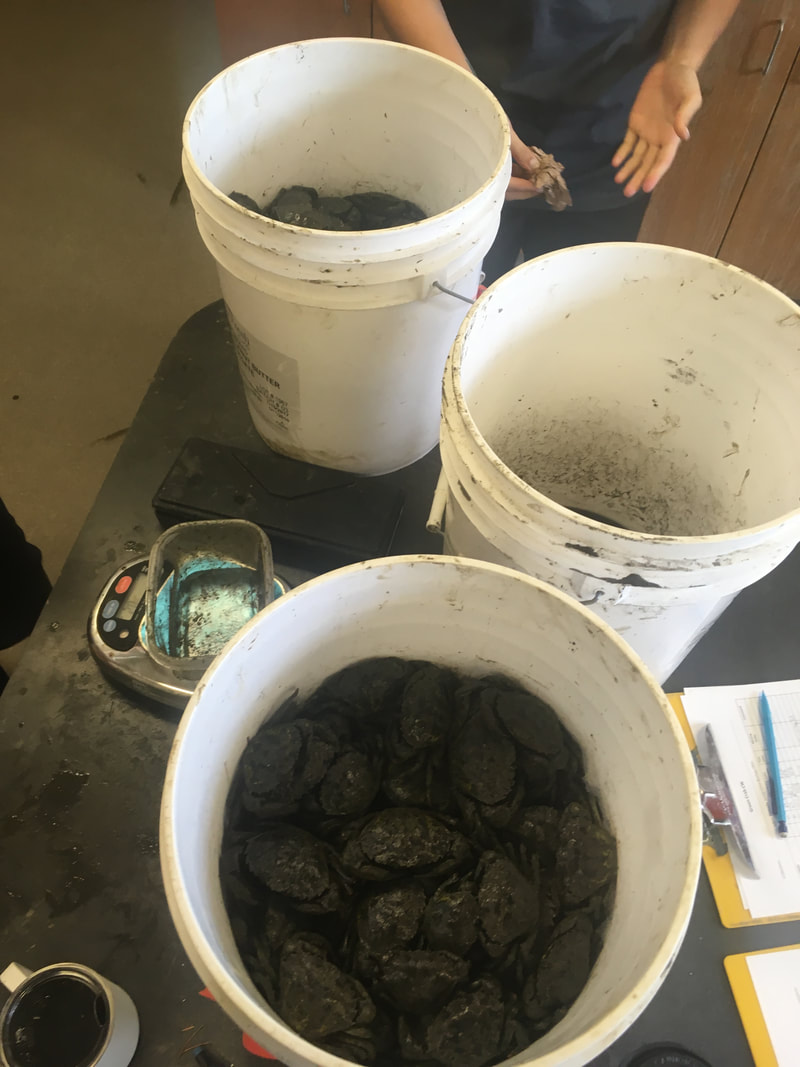
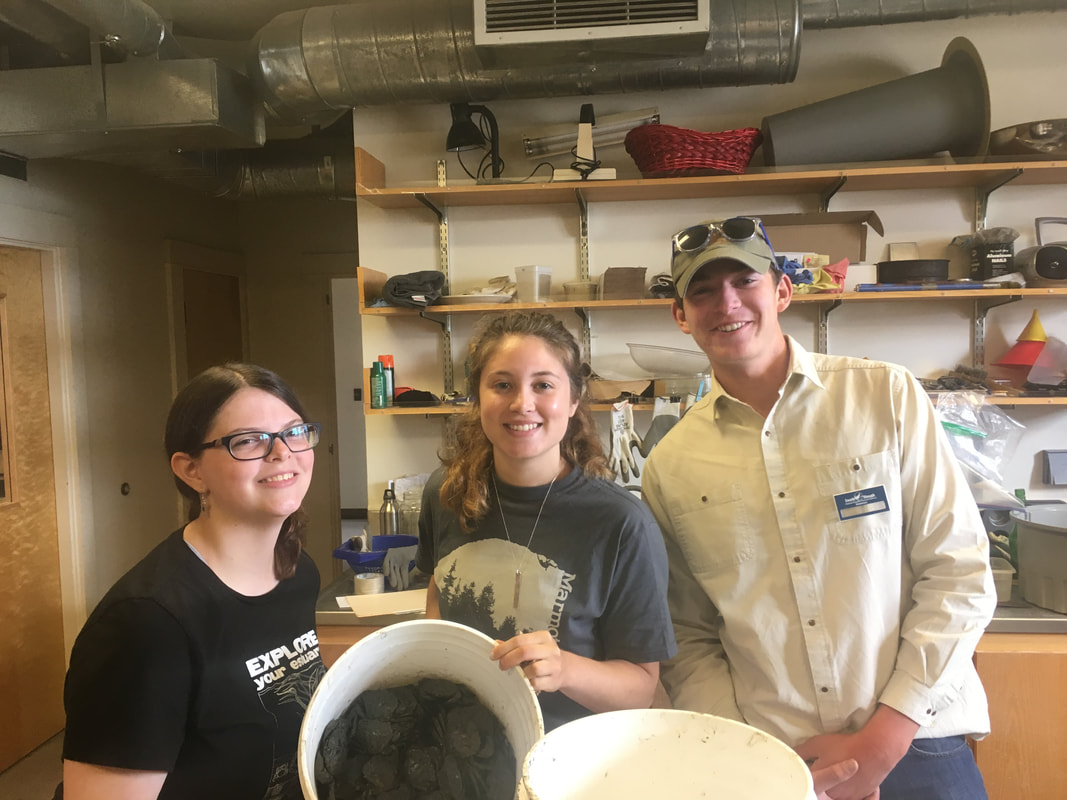
This week began in earnest when I caught a shocking number of invasive green crabs at the Coos History Museum and at Isthmus Slough. Over a single twenty four hour trapping period I trapped over 300 crabs between these two sites. This would have been overwhelming for me to process all on my lonesome back in the lab but I had some awesome volunteers who were willing to sit in the lab with me for two hours weighing crabs.
 The Coos History museum, my highest number of crabs per trap this week came from the area to the right with the pilings When I get this many crabs in one session it’s important to stay organized (a skill I am still developing). I separate out crabs I catch into two buckets - one bucket for green crabs that are caught in newer model fish traps, another for green crabs caught in older model traps. I label each bucket with flagging tape in order to keep the crabs straight, though especially when I first started I tended to mess up the order of my buckets. By now my crab sorting skills have improved and these sorts of mistakes are a lot less frequent. The more astute observer will observe a sneaky third bucket, this one is just for stakes and bait containers.
I’ve worked a lot this week to study the difference between the catch efficiency of the older and newer crab traps. One would assume this operation to be straightforward: take the average number of crabs I catch in each trap type and see which one has a higher average. Interestingly being able to determine if there is a difference in how many crabs each trap catches is turning out to be a much more complex operation. Variables such as the site where I set out the traps and when the traps were deployed also need to be taken into account as these will impact the average number of crabs I catch in each trap. For example I could observe that over time the number of crabs I catch in the new traps could slowly increase as they age and more resemble the more worn older traps. Simply taking and comparing the average of these two traps wouldn’t really capture this variability.
As a result of this thinking I have once more turned to statistical software which has the power to take these variables into account. I’ll spare you the nitty gritty details, but my first tentative result is that the new traps catch fewer green crabs than the old traps. I’m not really sure why yet, that will be a problem to figure out next season by making some careful modifications to the traps and running some tests.
0 Comments
In the field this week I turned my attention back to the South Slough, conducting replicate trapping sessions at sites I have already sampled. I returned to sites in the Slough loaded up with crab traps.
In my blog I tend to focus on fieldwork because of the pretty pictures, but that doesn’t mean that the rest of my day doesn’t deserve a mention. This heretofore neglected half of my day is typically spent preparing for the next session in the field, entering data into the computer from my last sampling, and thinking about how I will analyze these data to answer my research questions. Even though this part of research isn’t photogenic it is still both engaging and worthwhile!
I’ve spent a lot of my time indoors formulating relevant research questions, aspects of the green crab invasion that really fascinate me. Currently I am curious as to 1) Are green crabs are more abundant in the South Slough National Estuarine Research Reserve than in 2016 and 2017? 2) How does the number of green crabs I catch relate to physical and chemical conditions in the estuary? and 3) Is the green crab population influencing the size of the native shore crab population? These are some pretty big questions so they require big data. I’m starting to dig into datasets from other green crab researchers to look for trends in the population in the estuary. There’s a lot of information so I’m dusting off my statistics notes, grabbing books from the library, and looking up statistics coding languages. Brushing up on this Stat will allow me to better analyze all the data I have access to and relate it back to real world questions. 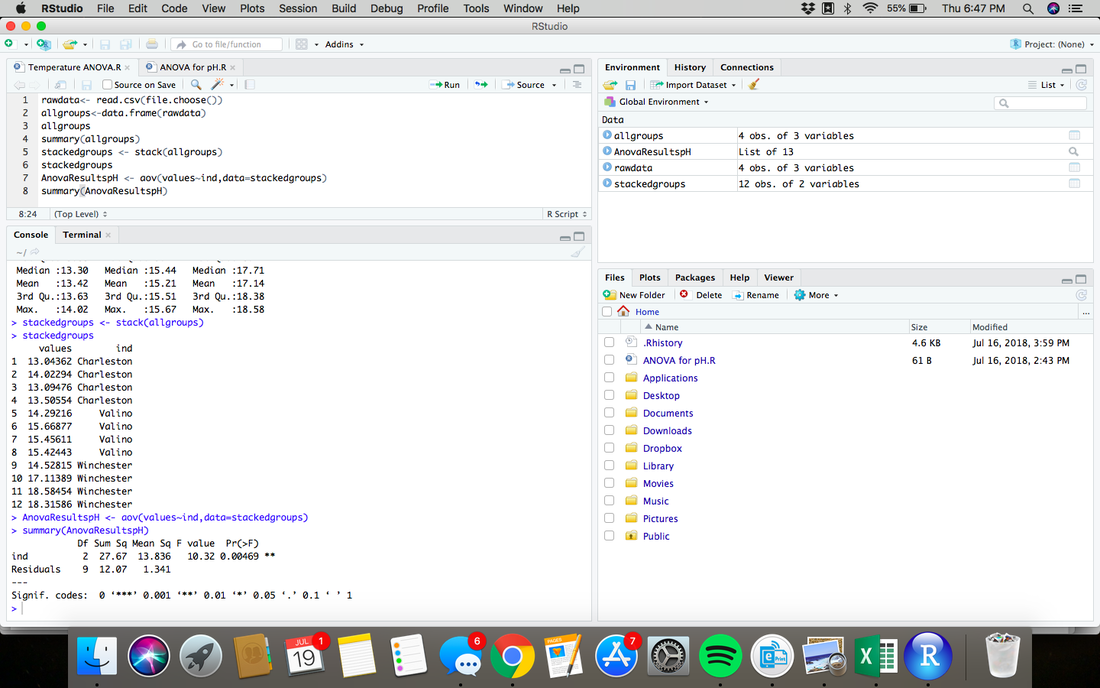 Above is code I wrote all by myself to analyze data I collected all by myself! Even though this is one of my more boring photos, it documents a moment in which I was thoroughly excited to apply what I learned in class to the real world.
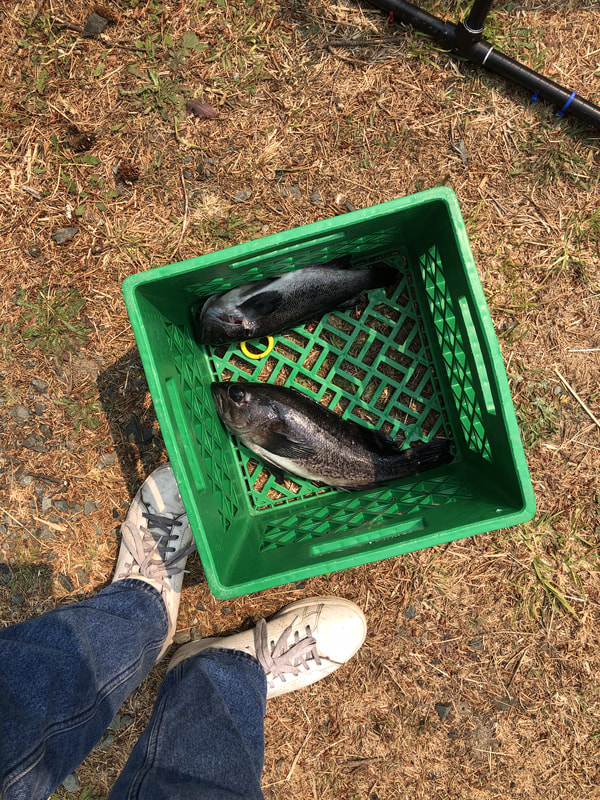
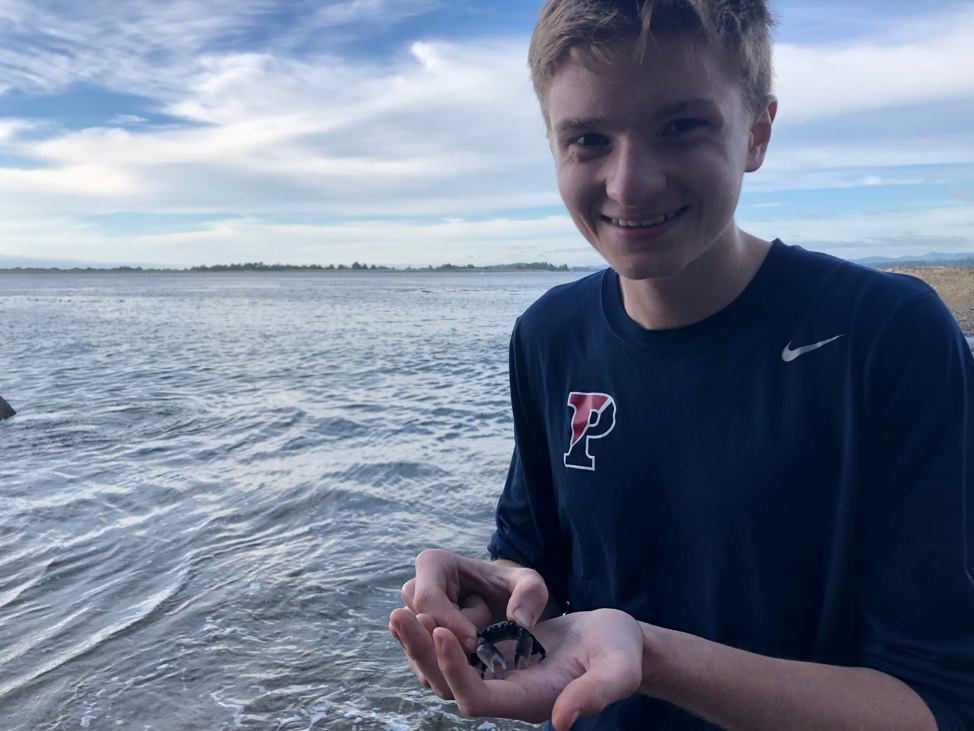
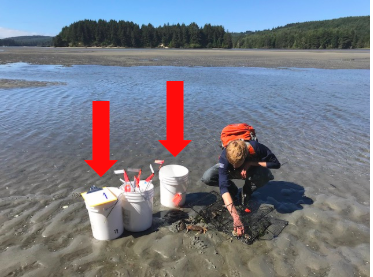
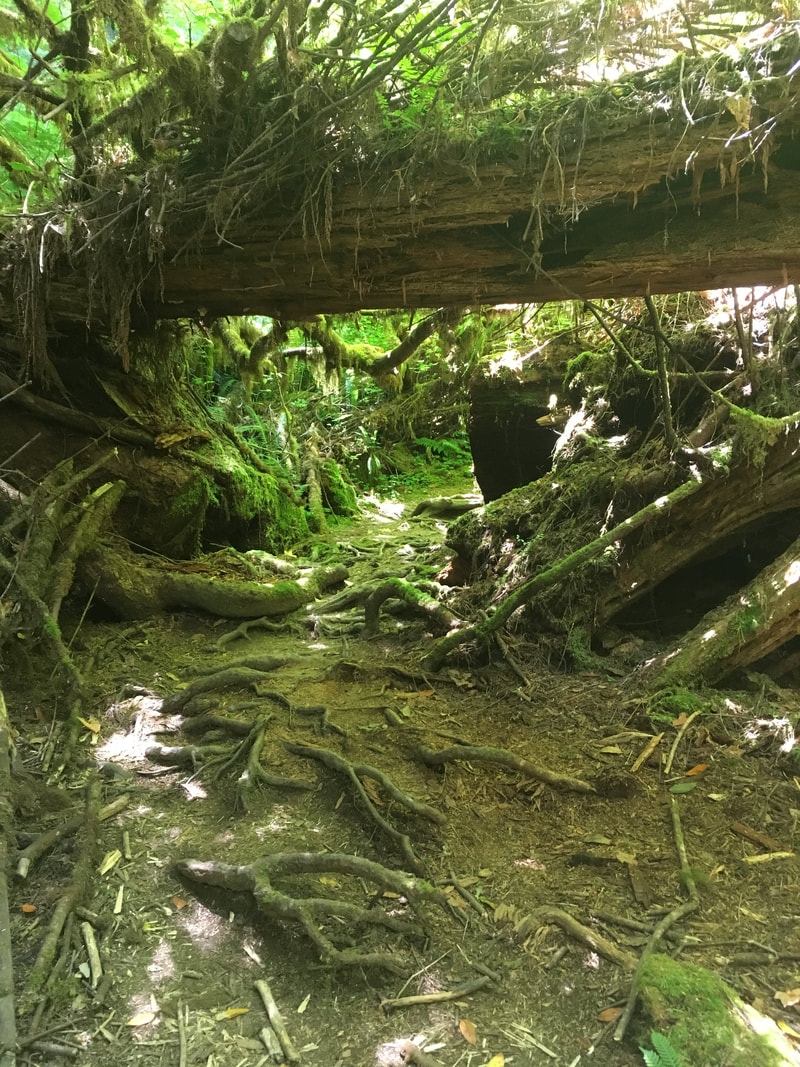
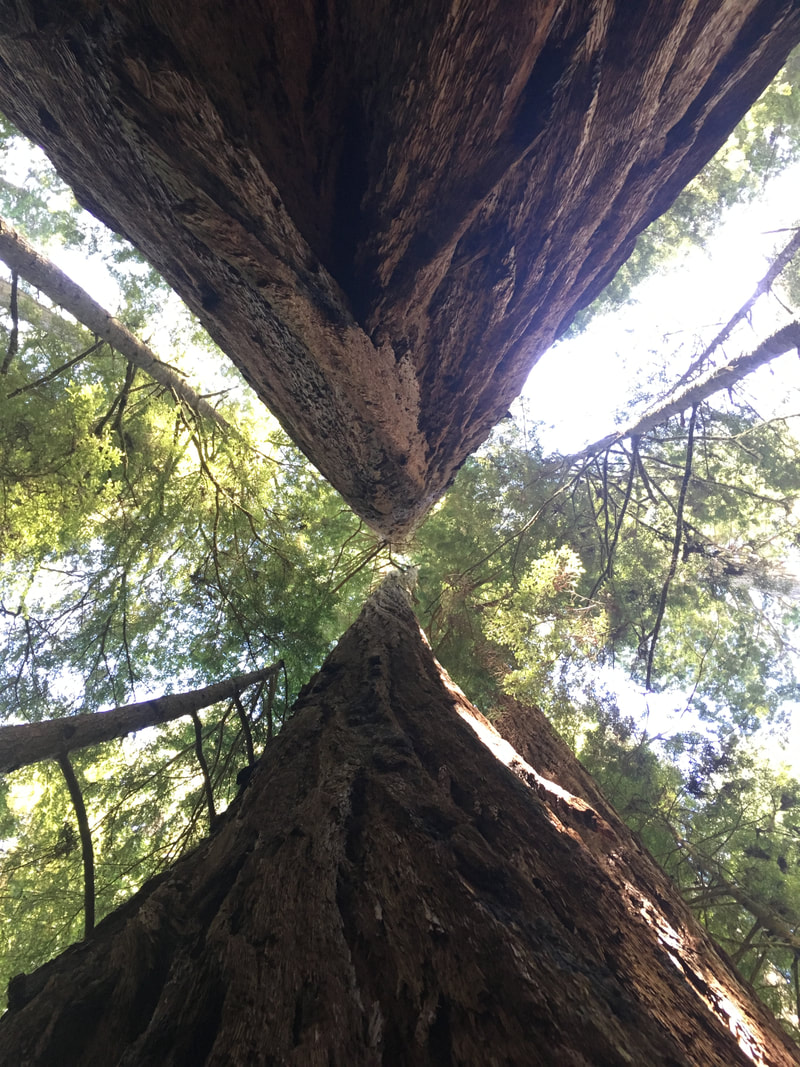
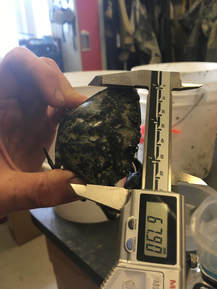
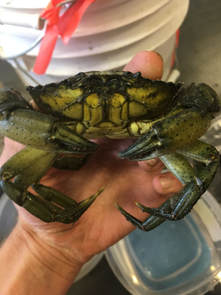
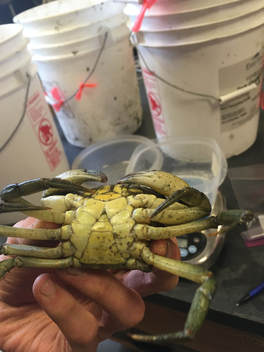
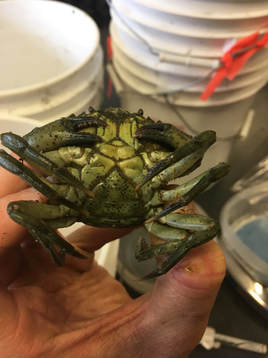
This week I journeyed further afield in Coos Bay with my crab trapping. My first two weeks of sampling crabs have centered on just the South Slough estuary. Now I’m venturing further out into the region to see how crab populations have changed on a larger spatial scale. I was joined this Wednesday by Makinna Miles, who was an awesome helper despite getting up at 5:30 am, and wading through knee-high mud! A little bit more about where I am trapping crabs. I am looking at seven sites in the South Slough estuary which span the range of physical habitats found in the slough. They begin with the more ocean-like sites near the estuary mouth, and extend southward toward more marsh-like sites where freshwater inputs change the physical conditions. The Slough is a great place to trap because it is part of the National Estuarine Research Reserve System so it has several sensors throughout the marsh recording data about the physical environment, and previous researchers have trapped there for green crabs extensively. I also want to get a sense of how green crab population is changing in the rest of Coos Bay so I am expanding my focus. I am adding eight sites in the greater Coos Bay region to see how green crab abundance is changing on a larger scale. Since I have access to crab catch data from several previous years in this region I can look for connections between how many crabs have been caught, and large scale environmental trends. I am still figuring out exactly how I’ll do this so stay tuned for next week! 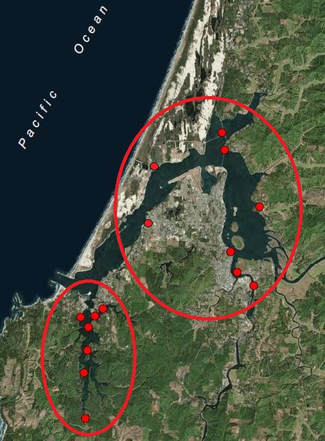 A map of the sites I am sampling this year. In the south west corner are sites in the SSNERR, while in the map center are sites further out in Coos Bay. In other news this past weekend was my first trip to see redwoods. I went with a few of my fellow interns on an overnight camping trip to see these giants. I was awed as we walked through the first primary forest I have ever experienced. We drove down on Saturday morning, and spent the day hiking in the Jedidiah Smith State park, spent the night in the Six Rivers National Forest, and drove back on Sunday morning. We had car trouble along the way, but it merely served to give conclusive evidence that I am surrounded by some really positive people here at OIMB! Last week I left my readers with a suspenseful final question: What happens to the crabs that I collect out in the estuary? Now for the answer! All of the invasive green crabs I catch out in the field are brought back to the lab. In the lab we measure the maximum width of their carapace (the hard upper shell), their weight, sex and color of the abdomen.
Male and female crabs can be distinguished by the shape of their, “apron,” a distinctly shaped flap on their underside.
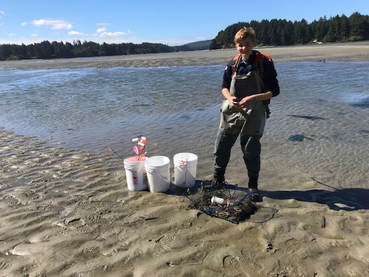
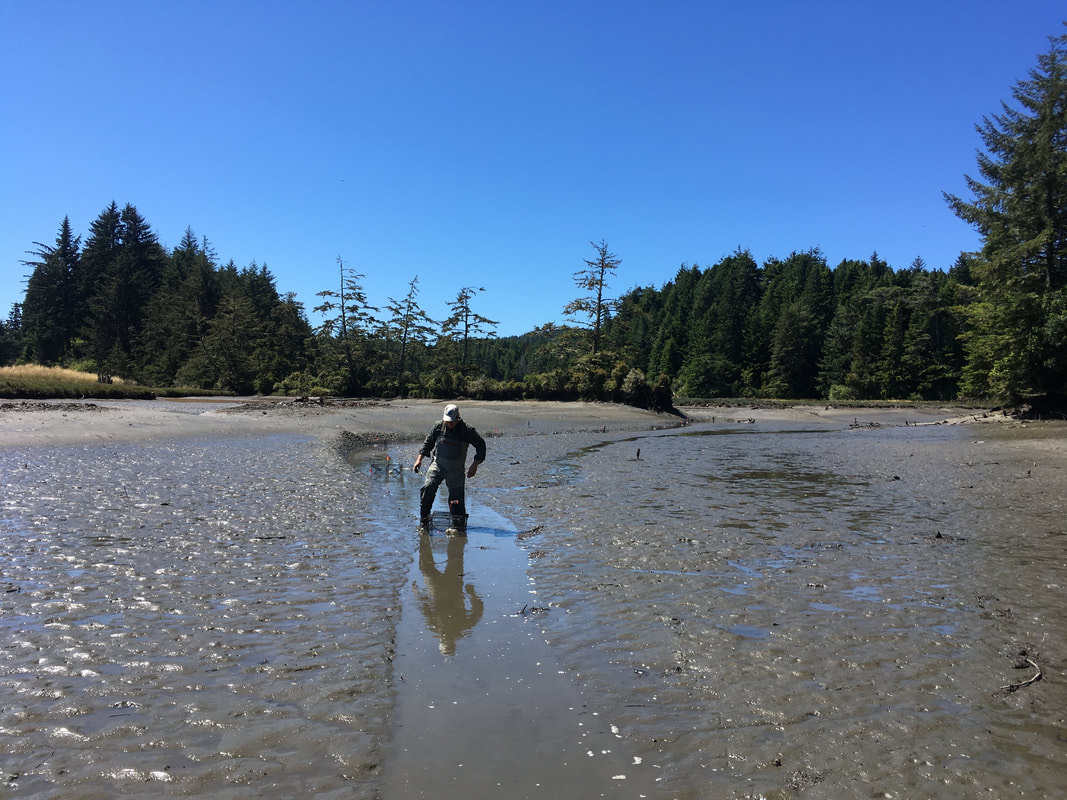
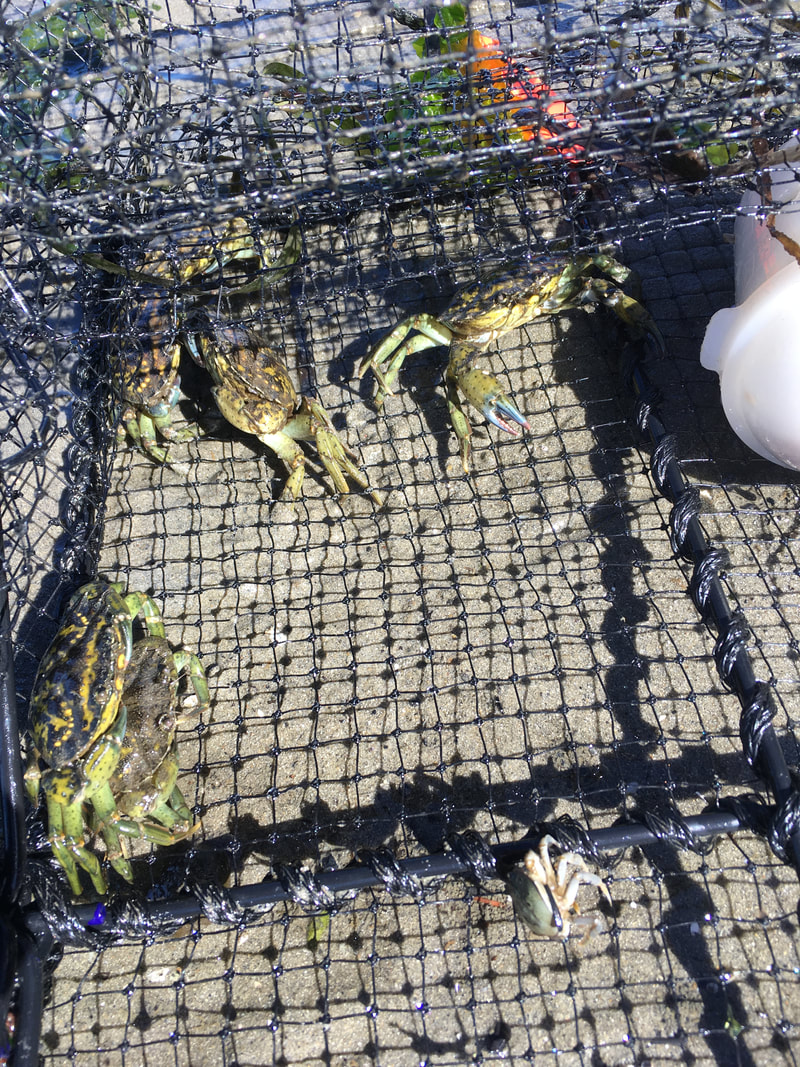
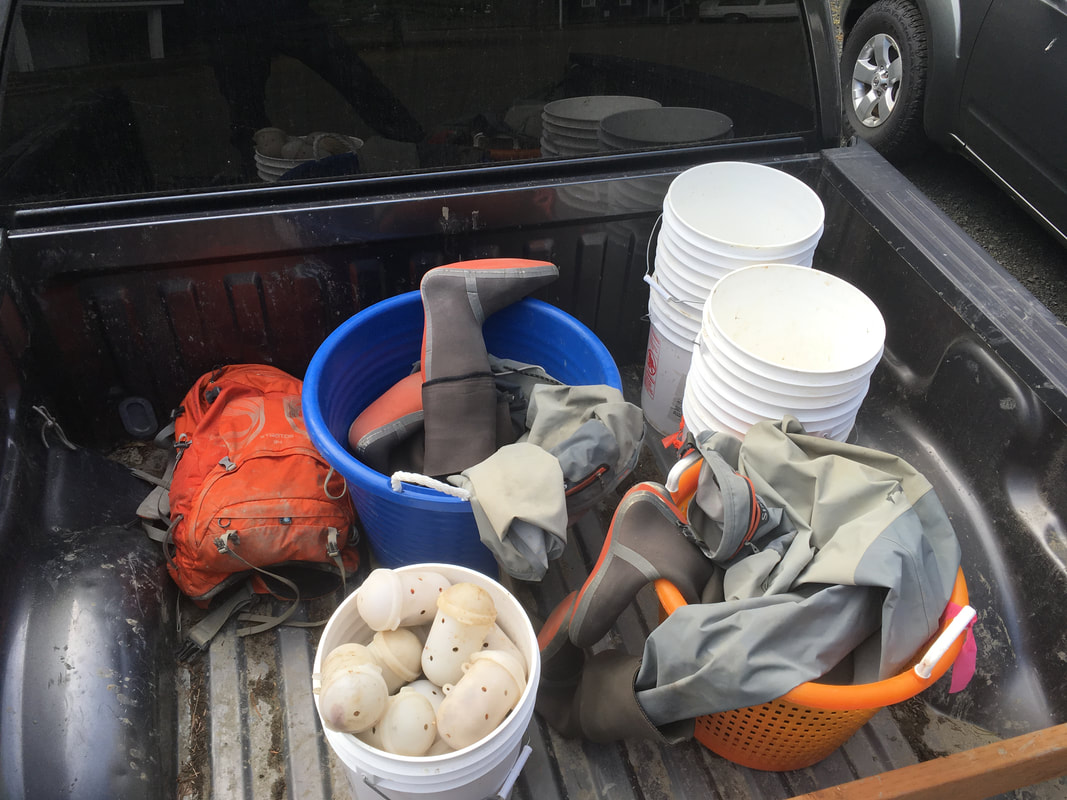
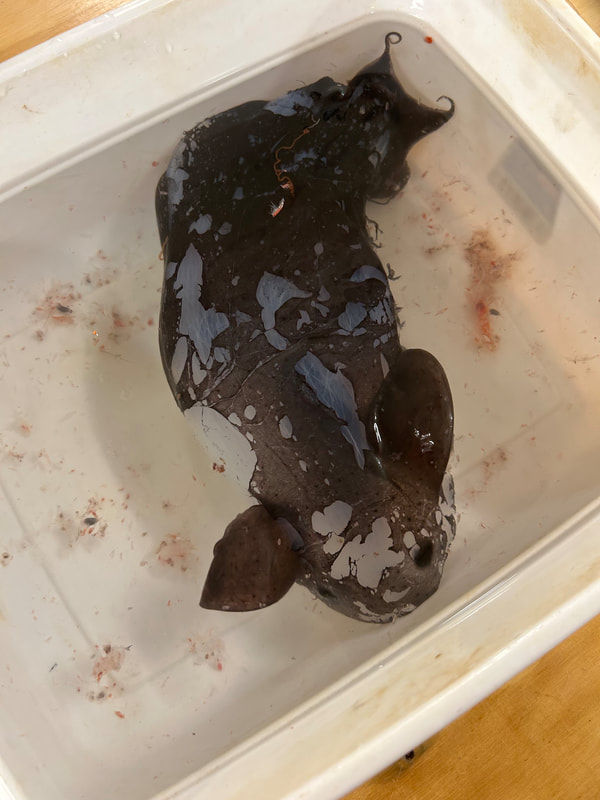
After the data is recorded crabs are then sent to their final resting place in the freezer where they are being preserved for a genetic study. 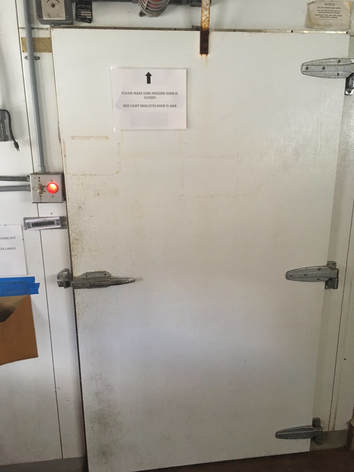 The door to the OIMB freezer So why record these data once I return to the lab? Why all this trouble? By looking at crab size we can figure out how old they are. Because green crabs generally spawn during the same period of the year, crabs that are similar in size are likely to be the same age. By recording the sizes, weights and color of the crabs we can get an idea of when they were spawned. By looking at the conditions during years when a lot of crabs were spawned we can begin to understand which years had the most favorable conditions for green crab survival. I am trapping at 7 locations in the SSNERR where previous researchers have looked in order to figure out how the abundance of crabs in the estuary has changed. I also want to figure out how the number of green crabs we catch during a 24 hour trapping period relates to what the physical conditions of the estuary are like. Physical and chemical gradients in estuaries vary on a daily basis and I am interested in how these factors impact the ability of green crabs to survive. I’ve even had good fun this week outside of my research with the fellow interns in my cohort. We embarked on a camping trip to the Cape Arago state park campground and enjoyed a night of s’mores and campfire fun. The following morning we ventured out for exploring some of the tidepools at the state park’s south cove. Once again I was amazed by the diversity of all the invertebrates teeming amongst the briny boulders along the shore. Unfortunately I wasn’t able to get any pictures due to a depleted phone battery, but we did manage to get a group photo of our cohort at the pools. 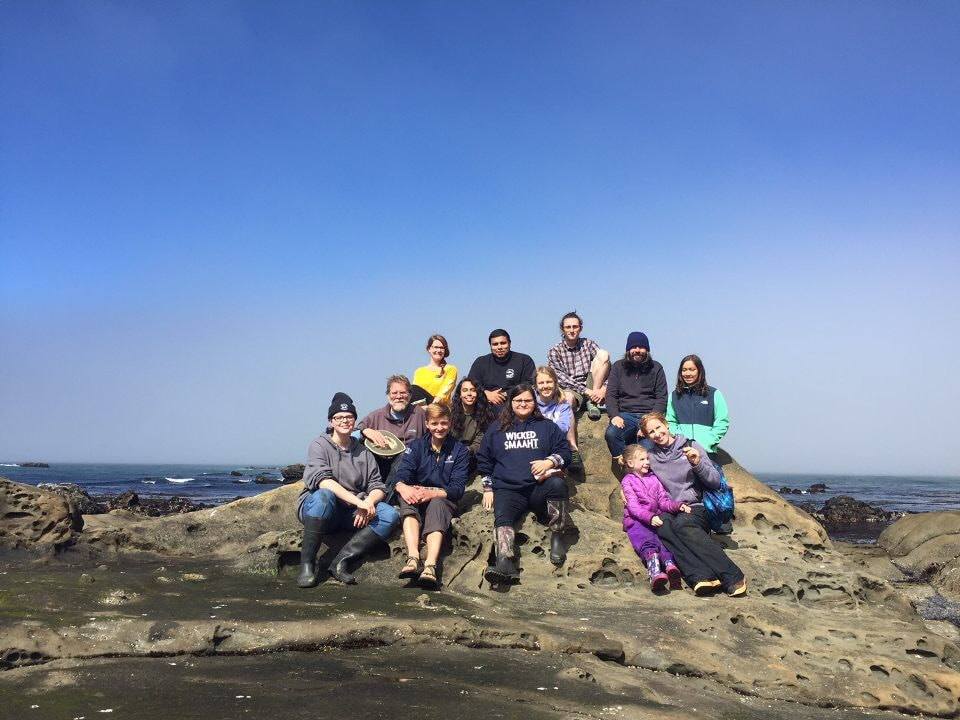 My week began with a trip on the OIMB R/V Pluteus (a 20 feet long ship) during which I got to see critters that were totally alien to me. We were dredging along the seafloor to see what we could find. Some of our finds are pictured below, along with the shadow of “expert” photographer yours truly. 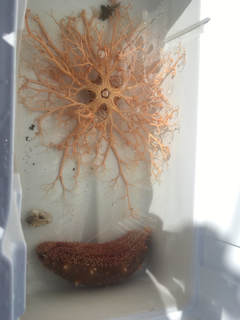 For those that aren’t familiar with dredging, basically you take a large metal scoop with a net attached and drag it along the seafloor and see what turns up. I was amazed by creatures that I had never seen before magically being brought up from 150 feet of water. On the left is a fraction of our haul from dredging. At the top is a basket star, below a hermit crab inside its shell, and at the bottom is a sea cucumber. For scale I’d estimate the sea cucumber was around a foot long. 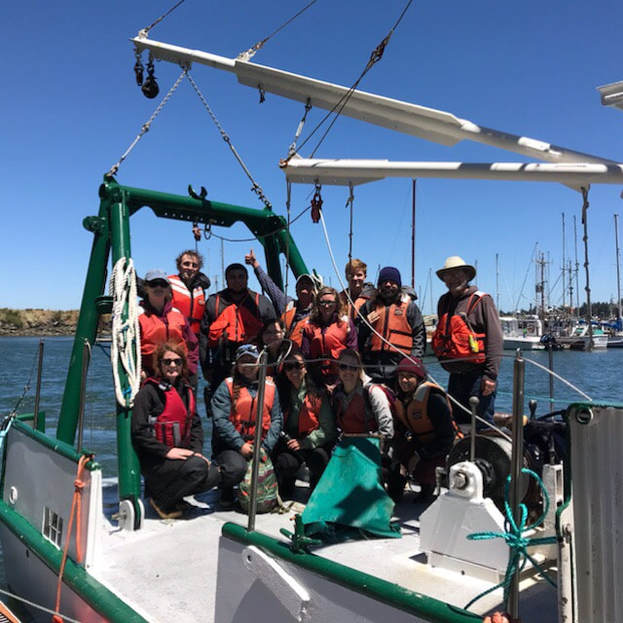 The REU crew aboard the R/V Pluteus along with Dr. Richard Emlet and Captain Knute! This week has also seen significant strides in my own research as I move from a phase of pure inquiry and background research to a phase of execution (though a lot of inquiry remains). I have decided that as part of my project I want to trap green crabs in the South Slough Estuary to characterize their distribution and relative abundance in comparison with that of previous years. 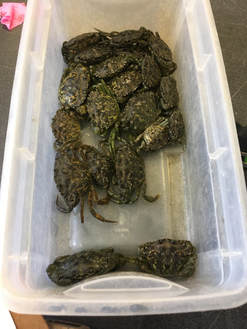 Now for a truncated history of the Invasive European green crab (Carcinus maenas).These aggressive Cancrid crabs were native originally to Europe, but hopped the Atlantic via sailing vessels in the early 19th century. They have since spread across the North American coast. My project is focused on the Coos Bay region of Oregon, where green crabs were first found in 1998. To make a long story short researchers think their larvae were carried north from the San Francisco Bay during the late 1990’s via northward moving current system. Left: A batch of green crabs caught here in the South Slough Now back to the present! This summer I will be deploying traps at key sites within the South Slough National Estuarine Research Reserve to characterize how the population in the estuary is changing. The traps I’m using are called Fukui traps and are made in Japan to catch fish, but they also happen to work quite nicely for green crabs. One is pictured here below just to give an idea of what they look like. 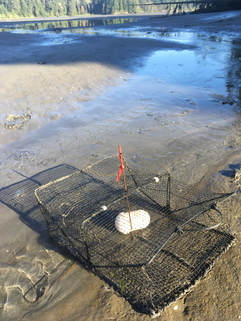 The white canister inside the trap is loaded with bait ( tuna scraps) and staked down into the marsh sediment. Crabs can enter through either side of the trap, but once inside are unable to leave through the funnel shaped entrance. A Fukui trap in its natural habitat. The white cylinder inside is full of bait 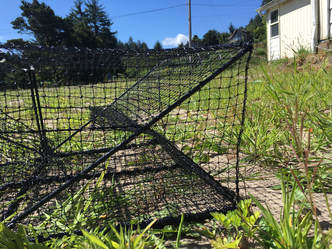 Fukui trap entrance - crabs can enter through the funnel shaped entrance, and are handily trapped inside! I’m placing the traps out in the estuary during low tide (which means getting up at 5 am!) so the whole area typically looks sort of like this: 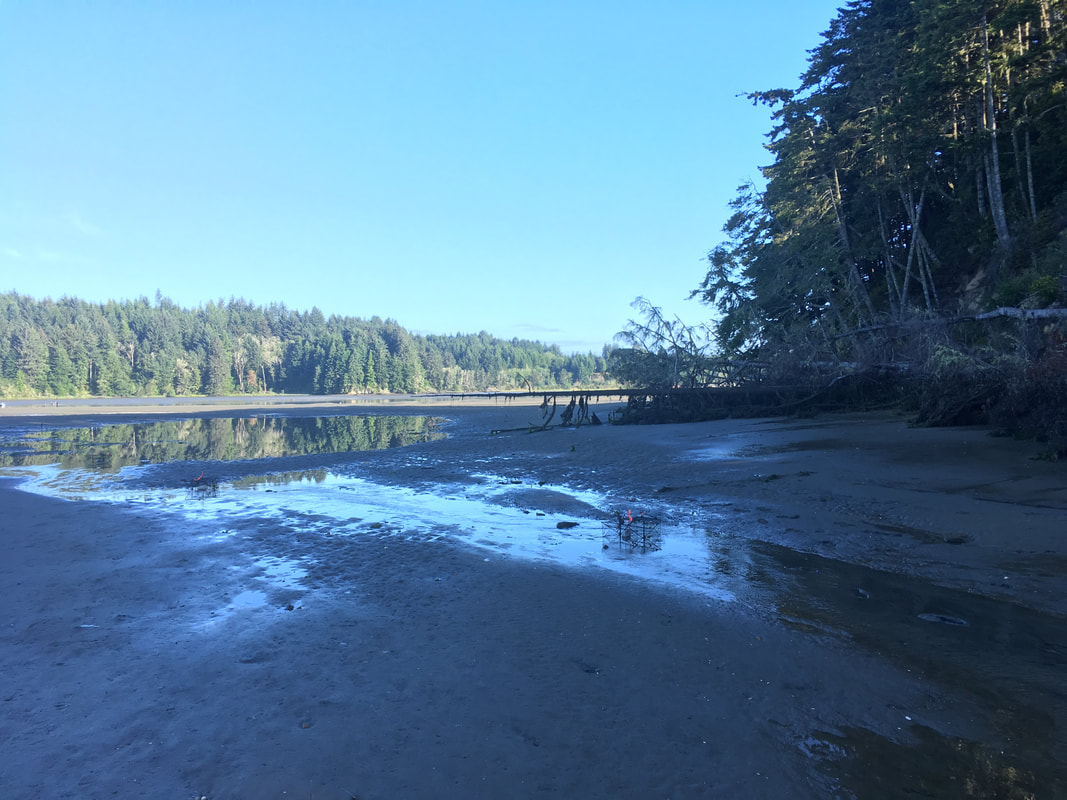 This area will be inundated with seawater within a few hours, so setting out the traps during the low tide ensures that the traps will remain underwater for a solid twenty four hours until the next low tide.
What I am doing with these crustaceans once I trap them is also super cool (though I am still figuring that part out) so tune in next week to find out! |
AuthorI’m a rising junior at the University of Pennsylvania studying ecology and evolutionary biology. When I’m not doing science I love doing pretty much anything outdoors. I’m an avid backpacker, runner, paddler and rockclimber. Finally I love to read fiction in pretty much any form. Archives
August 2018
Categories |


 RSS Feed